
Due Diligence
The Logic of Investment Manager Pairings
Manager Pairings to Counter Periodic Underperformance
June 16, 2026 | Derek Beiter
“In this world, nothing can be said to be certain, except death and taxes”
– Benjamin Franklin
… “and your investment manager hitting a patch of underperformance”
– LPL Research (only partly in jest)
According to our latest study of active management, 96% of active U.S. equity mutual funds with a 10-year record had at least one three-year period of underperformance relative to their assigned benchmark at some point over the last 10 years. This same set of funds outperformed in roughly half (47%) of the periods. So, while active management was not poor overall, and pockets of strong performance occurred, it has been extremely difficult for any given manager to never underperform.
One strategy for dealing with the near-inevitability of manager underperformance is manager pairings. Even within a particular equity asset class, such as large cap growth, it may be prudent to utilize two funds or managers. The basic logic is as follows.
- Identify two investment managers believed to offer outperformance potential over a full market cycle. This may be based upon historical tendencies and a going-forward assessment of whether the historical patterns are expected to persist.
- Identify the points in time when each manager has tended to perform particularly well or poorly. Even if a manager has not underperformed during its existing history, it is still important to anticipate adverse market environments that may cause future underperformance.
- Determine the allocation to each manager in the pairing. This could be a simple 50/50 blend or include a tilt towards a manager in which the investor is more confident or expects to be more consistent.
A Tale of Two Funds or Managers
The chart titled “Rolling Three-year Excess Returns versus Benchmark” shows rolling three-year excess returns for two hypothetical funds or managers. Excess return is simply the return of the investment minus the return of the benchmark index. Plots above zero indicate periods when the investment is outperforming, and plots below zero indicate periods of underperformance.
- Fund or Manager A (shown with a blue line) is a hypothetical active investment portfolio with a solid track record, outperforming its benchmark index in 68% of the rolling three-year periods over the last 10 years. Still, it had periods of underperformance, including the three-year periods ending in 2018–2020 and the most recent three-year periods.
- Fund or Manager B (orange line) is a hypothetical active investment portfolio with a solid track record, outperforming its benchmark index in 58% of the rolling three-year periods over the last 10 years. Its underperformance occurred in the three-year periods ending in 2016 and 2017, as well as in 2022–2024.
- The second chart, titled “Rolling Three-year Excess Returns of a 50/50 Blend,” shows the hypothetical performance of pairing Manager A and Manager B in equal allocations. The hypothetical blend has increased the consistency of relative performance, with the pairing outperforming the benchmark in 95% of time periods.
Rolling Three-Year Excess Returns versus Benchmark
A hypothetical illustration

Source: LPL Research 03/31/26.
Disclosure: This is a hypothetical illustration, not the actual performance of a particular investment.
Rolling Three-Year Excess Returns of a 50/50 Blend
A hypothetical illustration
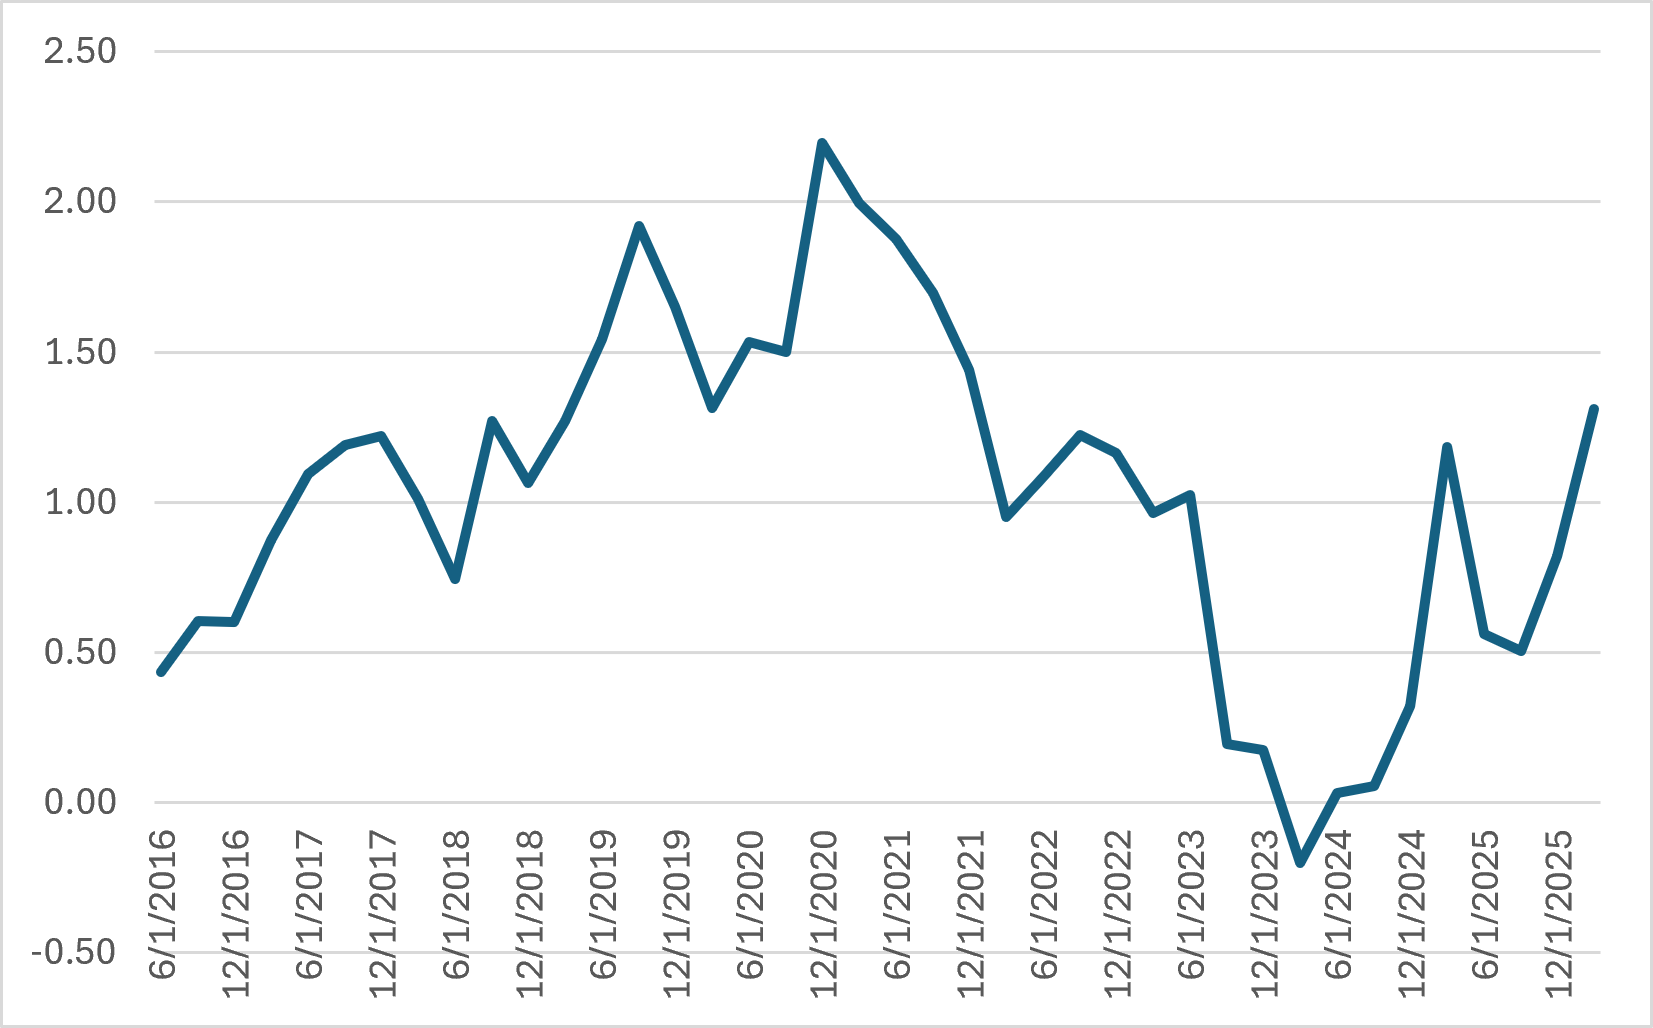
Source: LPL Research 03/31/26.
Disclosures: This is a hypothetical illustration, not the actual performance of a particular investment. The investments were rebalanced back to a 50/50 weighting on a quarterly basis.
Why Good Managers Have Pockets of Bad Performance
- A manager may emphasize securities of a certain type that have gone out of favor with investors, such as high-quality stocks during a low-quality rally or deep value stocks during a growth stock rally.
- They may take less risk than the index, underperforming during sharply advancing market environments.
- Ineffective stock selection. For a period of time, they may simply have chosen stocks that have underperformed those present in the benchmark index.
The Upshot
Some investors may question the merits of having two managers in the same asset class instead of picking one favorite manager. Even a manager with a strong performance record can be expected to have periods of difficulty outperforming the benchmark. Rather than putting all our eggs in that manager’s basket, we can attempt to anticipate times when that manager may struggle and select a complementary manager whose returns may “zig” when the other manager “zags.” If the investor expects both managers to outperform over a full market cycle, adding a second strong-performing manager may not necessarily reduce long-term returns. By pairing two managers together in the same asset class, investors may potentially benefit in these important ways:
- Increase the consistency of relative performance
- Reduce volatility
- Lessen the temptation of selling an underperforming manager that may be poised for a recovery
Important Disclosures
This material is for general information only and is not intended to provide specific advice or recommendations for any individual. There is no assurance that the views or strategies discussed are suitable for all investors. To determine which investment(s) may be appropriate for you, please consult your financial professional prior to investing.
Investing involves risks including possible loss of principal. No investment strategy or risk management technique can guarantee return or eliminate risk.
Indexes are unmanaged and cannot be invested into directly. Index performance is not indicative of the performance of any investment and does not reflect fees, expenses, or sales charges. All performance referenced is historical and is no guarantee of future results.
This material was prepared by LPL Financial, LLC. All information is believed to be from reliable sources; however LPL Financial makes no representation as to its completeness or accuracy.
Unless otherwise stated LPL Financial and the third party persons and firms mentioned are not affiliates of each other and make no representation with respect to each other. Any company names noted herein are for educational purposes only and not an indication of trading intent or a solicitation of their products or services.
Asset Class Disclosures –
International investing involves special risks such as currency fluctuation and political instability and may not be suitable for all investors. These risks are often heightened for investments in emerging markets.
Bonds are subject to market and interest rate risk if sold prior to maturity.
Municipal bonds are subject and market and interest rate risk and potentially capital gains tax if sold prior to maturity. Interest income may be subject to the alternative minimum tax. Municipal bonds are federally tax-free but other state and local taxes may apply.
Preferred stock dividends are paid at the discretion of the issuing company. Preferred stocks are subject to interest rate and credit risk. They may be subject to a call features.
Alternative investments may not be suitable for all investors and involve special risks such as leveraging the investment, potential adverse market forces, regulatory changes and potentially illiquidity. The strategies employed in the management of alternative investments may accelerate the velocity of potential losses.
Mortgage backed securities are subject to credit, default, prepayment, extension, market and interest rate risk.
High yield/junk bonds (grade BB or below) are below investment grade securities, and are subject to higher interest rate, credit, and liquidity risks than those graded BBB and above. They generally should be part of a diversified portfolio for sophisticated investors.
Precious metal investing involves greater fluctuation and potential for losses.
The fast price swings of commodities will result in significant volatility in an investor’s holdings.
This research material has been prepared by LPL Financial LLC.
Not Insured by FDIC/NCUA or Any Other Government Agency | Not Bank/Credit Union Deposits or Obligations | Not Bank/Credit Union Guaranteed | May Lose Value
For Public Use – Tracking: #1124106
Weekly Market Commentary | Introducing the IPO Class of 2026 | June 15, 2026
The U.S. initial public offering (IPO) market appears to be entering one of its most consequential periods in years. After a long drought following the 2021 issuance boom, a healthier macro backdrop, improved risk appetite, and a long queue of mature private companies have reopened the new-issue window. The potential 2026 class is unusual not only because of the number of companies considering public listings, but because several would be large enough to matter for major equity indexes, passive fund flows, and the broader market narrative around artificial intelligence (AI).
An important piece of framing we’d like to re-iterate upfront is that we are not making any judgment (or recommendations) about specific IPOs, or even IPOs broadly. That said, we remind readers of what the IPO process is designed to do: raise capital and create liquidity for the issuer and existing shareholders. Historically, new issues have produced a wide range of outcomes. Some of the market’s great companies became public companies through IPOs, but the first year after listing has often been volatile, and median performance has historically tended to trail the simple average because a relatively small number of large winners can skew the data.
Here, we explain the mechanics of the IPO process, review several high-profile candidates that may be planning to come to market, discuss why the 2026 issuance wave could matter for market structure, place the current environment in historical context, and provide an analytical framework for thinking about new issues. We are not making a recommendation on any individual company. Instead, we aim to provide a general framework for understanding IPO dynamics and considerations as companies transition from private to public markets.
IPOs 101: What Investors Are Actually Buying
An initial public offering, or IPO, is the process by which a private company sells shares to public investors and lists those shares on an exchange. The mechanics can sound straightforward: the company files a registration statement, hires investment banks to underwrite the offering, markets the story to investors during a roadshow, prices the deal, and begins trading. In practice, the process is a negotiation among management, existing shareholders, underwriters, institutional investors, index providers, and eventually retail buyers in the secondary market.
The distinction between the offering price and the first public trading price is especially important. The IPO price is the price at which shares are allocated by the underwriting banks, usually largely to institutional investors. Many ordinary investors do not receive meaningful access to that price. They buy after the stock starts trading, sometimes after a first day “pop.” A company can be an excellent business and still be a disappointing IPO investment if the first public price already discounts years of optimistic growth.
Investors should also understand lockups. In many IPOs, insiders and early private investors agree not to sell for a period, often around 180 days. When that lockup expires, additional supply can enter the market. That supply does not guarantee a decline, but it can create an overhang, especially when early investors have large unrealized gains and public-market investors are still debating valuations.
The Potential 2026 Class: Familiar Names, Unfamiliar Scale
Several companies, across sectors including technology and AI infrastructure, are in advanced stages of going public. These companies would arrive on public markets with brand recognition and private-market valuations that are far larger than the typical IPO. SpaceX is the most visible example, particularly after its public S-1 filing. LPL Research recently published a blog digging into SpaceX’s S-1 filing, “Counting Down to the SpaceX Launch”. Its business combines launch services, Starlink satellite broadband, defense and government work, and ambitious longer-term opportunities in space infrastructure and AI.
So-called “AI labs”, or “frontier AI model companies”, are another focal point. Certain AI-focused companies such as OpenAI have gained significant visibility due to rapid consumer adoption of large language model technologies. In terms of fund-raising and a potential public offering, on March 31, 2026, OpenAI announced a record $122 billion funding round at a post-money valuation of $852 billion, and on June 8 announced that it has confidentially submitted a draft S-1 filing with the SEC, which is among the first steps a private company must take prior to issuing and offering shares to the public.
Anthropic PBC is a San Francisco-based AI safety and research company with a focus on the enterprise AI market. Its Claude models are distributed directly and through partners such as Amazon Web Services, Google Cloud, Snowflake, Databricks, and Microsoft-related developer channels. On May 28, Anthropic announced a $65 billion fund raise, at a post-money valuation of $965 billion, and on June 1 announced that it has confidentially submitted a draft S-1 filing, paving the way for its own IPO.
The contrast between the two companies is useful for investors. OpenAI’s core advantage is distribution, with ChatGPT spanning consumer, developer, and enterprise use cases. Alternatively, Anthropic focuses primarily on business/enterprise customers, particularly coding and knowledge work productivity and automation, via Claude Code and Claude Cowork product lines, respectively.
At private market valuations of hundreds of billions of dollars, the market is underwriting not only a promising software product, but a long-duration bet on AI becoming a core layer of the economy, on model providers retaining pricing power despite intense competition, and on infrastructure spending ultimately translating into attractive margins. For both OpenAI and Anthropic, the public-market debate is likely to center on whether rapid revenue growth, consumer and enterprise adoption, and agentic workflows can offset high inference costs, training expenses, talent competition, litigation risk, and potential model commoditization.
Other recent and pending IPOs help frame the environment in which mega-deals may arrive. Cerebras, CoreWeave, Figma, Medline, and other recent listings have shown that investors are willing to fund differentiated growth stories, but performance has been uneven. Strong first-day demand has not necessarily translated into sustained outperformance. That is a useful reminder for investors preparing for larger and louder offerings.
Why This Matters for Markets
A normal IPO can matter a great deal for the issuing company and its shareholders, but it is usually too small to affect the S&P 500 or Nasdaq-100. The 2026 setup is likely to be different. A recent estimate from Goldman Sachs called for roughly $160 billion of U.S. IPO gross proceeds in 2026, which would be among the largest annual totals on record if realized, particularly when excluding the Special Purpose Acquisition Company (SPAC)-heavy distortions of 2021. The reasons 2026 could play out differently than prior large IPO years are the combination of large deals, low public floats, heavy passive ownership across markets, and faster potential index inclusion.
New issuance must be absorbed. Investors who buy a new IPO may fund that purchase by deploying cash, but they may also sell existing holdings. If several very large transactions arrive close together, that “making room” process may add to volatility. The risk is most relevant when market liquidity is thin, positioning is crowded, or the new issues overlap with themes investors already own heavily, such as mega cap technology and AI infrastructure.
Index rules are an increasingly important part of the discussion. Nasdaq recently implemented changes to the Nasdaq-100 Index designed to allow faster inclusion of large newly public companies, as well as changes in weighting methodologies related to float-adjusted market capitalization. Previously, newly listed companies often had to wait until an annual index reconstitution before joining the index. The updated rules now allow Nasdaq-listed companies to be evaluated for “fast entry” if their market capitalization ranks within the top 40 of the current constituents’ market cap, providing a path to joining the index in as little as 15 days. In terms of eligible market cap and float requirements, the new rules will include unlisted shares that are not publicly traded (such as those held by founders/insiders) in market cap calculations, and the 10% minimum float requirement has been removed. Regarding the “low-float” rule changes: while minimum float requirements have been removed, the index will now leverage a “modified market cap” calculation that caps the total shares outstanding at three times the free-floating shares.
On May 27, Russell FTSE indexes announced similar changes to “fast track” large IPOs as well. The Dow Jones S&P Index committee had been the “elephant in the room” in terms of deciding whether to change their own index inclusion rules, but on June 4 announced that it will not be making any changes as it relates to the treatment of socalled “MegaCap Companies” expected to IPO. This decision was seen as a surprise by many as it deviated from peers, and while there are surely some who disagree, we read the consensus feedback as positive. For what it’s worth, we agree with their decision and also viewed it positively.
Faster index inclusion matters because passive funds tracking an index will need to buy a stock soon after it joins the benchmark. Active managers may also face pressure to own it because omitting a large benchmark constituent can create active risk. In plain English, investors who own broad-market index funds could become shareholders of newly public companies much sooner than they would have in prior cycles.
These factors combined all suggest that the current environment has unique features not present in recent large IPO calendar years: higher index concentration, larger passive assets, faster index inclusion, the possibility of very low float for massive companies, and an AI trade already central to market leadership.
What History Says About IPO Performance
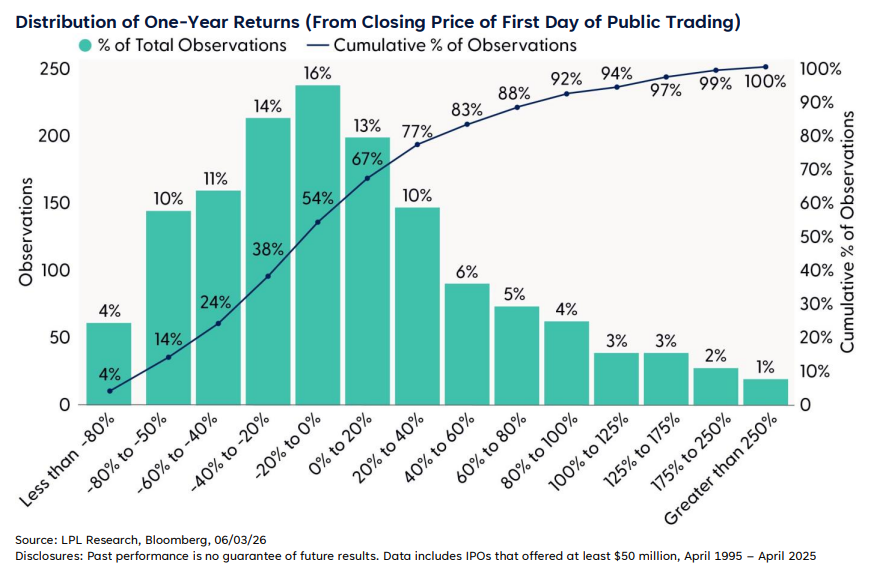
Our prior analysis (“How To Think About IPOs in 2026”) of roughly 1,500 IPOs over the last 30 years found that IPO performance has been a mixed bag, and returns have been quite volatile. Measuring from the close of the first trading day, the average one-year return was positive, but the median return was negative. The results of our analysis were, for the most part, in-line with what any Statistics 101 student should expect in a distribution of asymmetric data with a long right tail of outcomes that has theoretically unlimited upside but capped downside, as the most negative potential data point would be -100% (the most an unleveraged investor can lose is 100% of their capital). Such a right-skewed distribution will show a larger mean (average), which for our sample of returns was 10.4%, than median, which was -4.7%. A few outsized performers can pull up the average even when the median IPO performance is less impressive. The distribution of performance is detailed in “Distribution of One-Year Returns (From Closing Price of First Day of Public Trading)”.
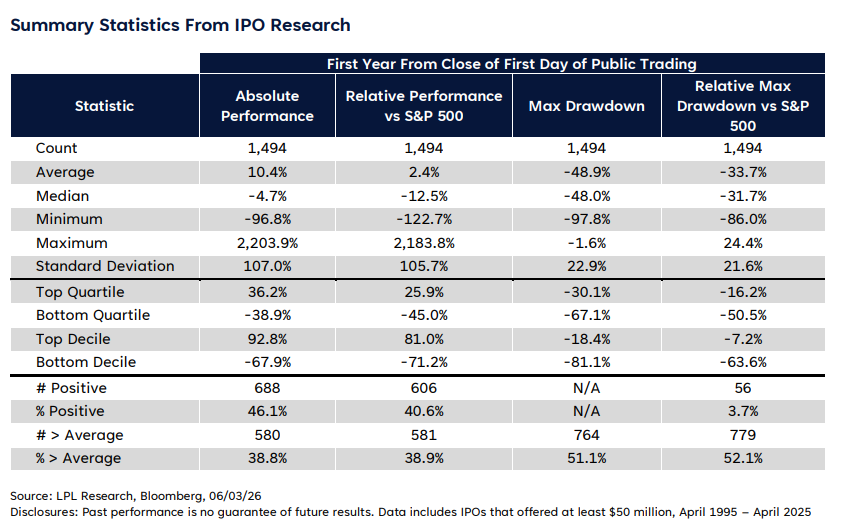
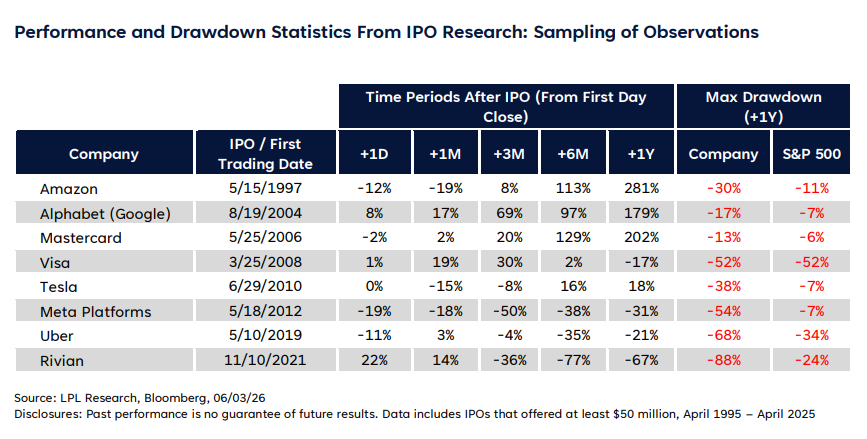
Furthermore, the path of price performance has often been uncomfortable regardless of the endpoint. The average maximum drawdown in the first year after an IPO was 48.9%, and the median drawdown was similar at 48.0%. That means even most positive outcomes typically experienced steep declines in their first year of trading in public markets. Relative performance was also challenging — only 40.6% of the sample outperformed the S&P 500 during the first year after listing. Additional highlights from our analysis are presented in “Summary Statistics From IPO Research”, and performance and drawdown metrics from a subset of new issues from our dataset are presented in “Performance and Drawdown Statistics From IPO Research: Sampling of Observations”.
AI IPOs and the Narrative of the AI Trade
The AI trade has been supported by a relatively simple bull-market narrative: the companies spending the most on AI infrastructure (large cloud platforms and hyperscalers) are profitable, cash-generative businesses, while many of the most visible beneficiaries are established semiconductor, networking, power, and data-center companies. That has led many in the market to suggest that this cycle is different from the late-1990s dot-com internet bubble, when many public companies had limited revenue, no profits, and business models that were still largely theoretical. However, a wave of AI model company IPOs could complicate that narrative, as the market will soon be asked to underwrite a different part of the AI ecosystem.
Said differently, we may be entering a new part of the cycle, where public market participants will receive quarterly financials for not only the beneficiaries of the AI capital expenditure boom (infrastructure providers, a.k.a. the “picks and shovels”) but also for the application and model layers where adoption and user growth is high but long-term profitability remains an open question. The fundamentals of most large public AI infrastructure providers have perhaps raised some concerns around capital spending, but much of the spending up to this point has been supported by operating cash flow from existing business lines. If the market begins to question the economics, the narrative could shift from “AI capex is funded by profits” to “AI growth requires continuous capital.” Further, the valuation math for the AI model companies embeds expectations not only of continued near-term adoption trends, but also confidence that they will become durable, profitable businesses in the AI economy.
Separating the Business From the Stock
As formerly private companies debut on public markets, analysts should look to answer three questions that are often blended together. First, is the company strategically important? Second, is the business model likely to produce attractive long-term economics? Third, is the valuation attractive enough to compensate investors for the risks? The answer to the first question can be yes, while the answer to the third is no. Note, that any analysis done around valuation must also must be cognizant of the fact that ordinary investors won’t have access to whatever IPO price that may be reported in the press; once a new issue begins trading, the price is dictated by the market, not bankers or institutional investors or founders. So, valuation analysis must be nimble, and analysts should not lose discipline in the face of FOMO (fear of missing out). See our historical analysis again as a reminder of potential volatility. Patience is a virtue.
Any practical company evaluation framework should start with revenue quality. Recurring revenue, a diversified customer base, strong retention, and pricing power generally deserve more credit than one-time project revenue or revenue concentrated in a few customers. Next up, the path to profitability and free cash flow should be evaluated. Many high-growth companies can justify near-term losses if those losses are funding durable customer acquisition or infrastructure that later scales. But losses caused by structurally high variable costs, intense price competition, or perpetual capital intensity are harder to make up in the future.
Valuation discipline is equally important. Price-to-sales multiples can be useful for fast-growing companies, but they are not a substitute for unit economics. A company trading at a high sales multiple must eventually convert revenue into earnings and cash flow. If the stock prices in near-perfect execution, even strong operating performance may not be enough. Conversely, some IPOs become attractive after the initial excitement fades, lockups expire, or the market gains more confidence in reported results. Again, we remind readers that patience is a virtue.
Finally, analyze the structure of the public offering. Float, voting control, lockup schedules, use of proceeds, relatedparty transactions, and index eligibility can all influence near-term trading. A low float can support a stock early by limiting supply, but it can also increase volatility and set up future selling pressure when additional shares become eligible for sale. Governance also matters. Super-voting shares, founder control, and complex benefit-corporation structures may be appropriate for some companies, but analysts should understand what rights they do and do not have.
Conclusion
The potential 2026 IPO wave deserves attention. It stands to provide public market participants access to many highly visible private companies in exciting, fast-growing industries, reshaping index composition faster than prior IPO cycles. It could also introduce a large amount of new equity supply into a market already defined by high concentration, heavy passive ownership, and elevated expectations for AI-related growth.
Our message is balanced. New public equity opportunities can be the starting point for extraordinary long-term investments, but the first public price is not automatically attractive just because the company is innovative. Historically, first-year IPO performance has been choppy, the median outcome has been negative in our sample, and drawdowns have been severe. The coming class may end up including one or multiple truly exceptional businesses. That still does not mean every new issue will be a good investment on day one.
For market participants, the framework should be disciplined: understand the business, assess the valuation, evaluate the path to profitability, consider the float and lockup structure, and be honest about position sizing. Public markets are very good at converting stories into prices. The hard part is determining whether the price leaves enough room for the story to unfold.
Asset Allocation Insights
The LPL Research Strategic and Tactical Asset Allocation Committee (STAAC) maintains its recommendation for a tactical equity overweight and fixed income underweight. While maintaining our equity and U.S. equity overweights, the Committee favors neutral style exposure as a result of stretched market positioning and technical indicators following the recent growth-led rally. As such, this view is expressed via a defensive factor tilt given our expectation for bouts of volatility until the macro backdrop begins to improve as the situation in the Strait of Hormuz eventually plays out to a resolution, allowing markets to refocus on a broadly healthy fundamental landscape.
Within equity sectors, we hold an overweight stance toward the energy sector due to logistical challenges surrounding normalizing global oil flows. The STAAC believes oil prices may stay higher for longer than markets currently anticipate and places value on this hedge against potential additional Mideast flare ups. We also remain overweight industrials, supported by strong earnings momentum, favorable technicals, and continued tailwinds from fiscal spending and AI investment.
LPL Financial does not offer access to or purchase of initial public offerings (IPOs).
This material is intended for informational and educational purposes only and does not constitute investment research, a research report, or a recommendation regarding any specific security or issuer.
Important Disclosures
This material is for general information only and is not intended to provide specific advice or recommendations for any individual. There is no assurance that the views or strategies discussed are suitable for all investors or will yield positive outcomes. Investing involves risks including possible loss of principal. Any economic forecasts set forth may not develop as predicted and are subject to change.
References to markets, asset classes, and sectors are generally regarding the corresponding market index. Indexes are unmanaged statistical composites and cannot be invested into directly. Index performance is not indicative of the performance of any investment and do not reflect fees, expenses, or sales charges. All performance referenced is historical and is no guarantee of future results.
Any company names noted herein are for educational purposes only and not an indication of trading intent or a solicitation of their products or services. LPL Financial doesn’t provide research on individual equities.
All information is believed to be from reliable sources; however, LPL Financial makes no representation as to its completeness or accuracy.
All investing involves risk, including possible loss of principal.
US Treasuries may be considered “safe haven” investments but do carry some degree of risk including interest rate, credit, and market risk. Bonds are subject to market and interest rate risk if sold prior to maturity. Bond values will decline as interest rates rise and bonds are subject to availability and change in price.
The Standard & Poor’s 500 Index (S&P500) is a capitalization-weighted index of 500 stocks designed to measure performance of the broad domestic economy through changes in the aggregate market value of 500 stocks representing all major industries.
The PE ratio (price-to-earnings ratio) is a measure of the price paid for a share relative to the annual net income or profit earned by the firm per share. It is a financial ratio used for valuation: a higher PE ratio means that investors are paying more for each unit of net income, so the stock is more expensive compared to one with lower PE ratio.
Earnings per share (EPS) is the portion of a company’s profit allocated to each outstanding share of common stock. EPS serves as an indicator of a company’s profitability. Earnings per share is generally considered to be the single most important variable in determining a share’s price. It is also a major component used to calculate the price-to-earnings valuation ratio.
All index data from FactSet or Bloomberg. All index data from FactSet or Bloomberg.
This research material has been prepared by LPL Financial LLC.
Not Insured by FDIC/NCUA or Any Other Government Agency | Not Bank/Credit Union Guaranteed | Not Bank/Credit Union Deposits or Obligations| May Lose Value
For public use.
Member FINRA/SIPC.
RES-0007122-0526 Tracking #1120632 | #1120634 (Exp. 06/27)
World Cup-onomics 2026: Economic Impact Preview
World Cup-onomics 2026: A More Diversified Economic Event
George Smith | Portfolio Strategist
Last Updated: June 11, 2026
The 2026 FIFA Soccer World Cup kicks off today, and it will look very different from prior tournaments, not just on the field, but economically.
For the first time, this event will be hosted across three countries: the United States, Mexico, and Canada. That structure shifts the World Cup from a concentrated investment into something closer to a diversified portfolio. Instead of one country absorbing the full cost and risk, exposure is spread across multiple economies, currencies, and cities.
Just as importantly, this will be the first soccer World Cup since 1994 to rely almost entirely on existing stadium infrastructure. That marks a sharp departure from recent tournaments, where large-scale construction drove costs. In 2026, the focus shifts from capital expenditure to utilization — layering incremental demand onto assets that already exist.
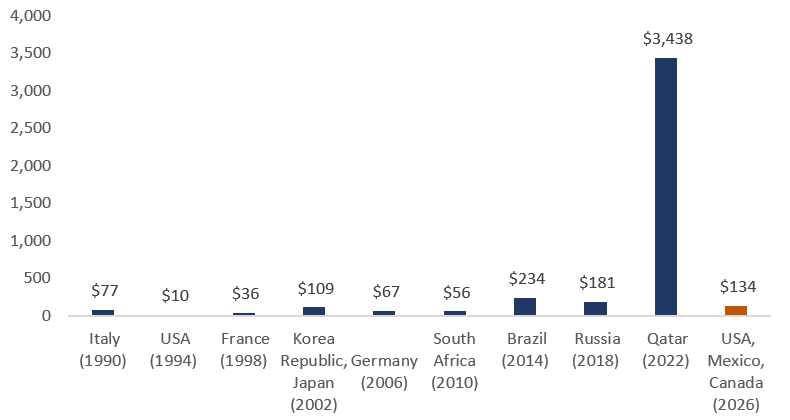
While the overall impact to the U.S. economy (given its immense size) is expected to be fairly negligible (0.05%), the utilization of existing assets materially lowers the bar for economic success. While the tournament is still expected to cost roughly $13.9 billion, it remains far below levels seen in recent cycles and significantly reduces the risk of underutilized “white elephant” stadium projects.
Cost Per Game to Host Soccer World Cup (millions U.S.$)
Source: LPL Research, FIFA.com 06/01/26
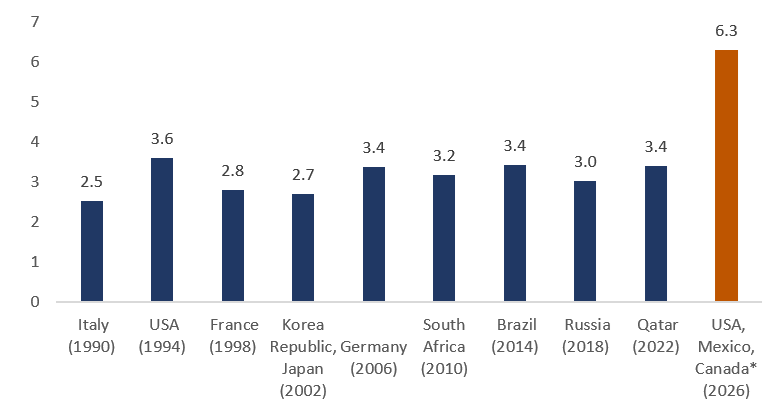
At the same time, the expanded 48-team format increases the scale of the event. The number of matches rises from 64 to 104, with total attendance expected to exceed six million, both record highs, with stratospheric ticket prices to match.
Total Fan Attendance at Soccer World Cups (millions of fans)
Source: LPL Research, Statista.com 06/01/26
*Estimated based on stadium capacities
The result is a more distributed and nuanced economic impact. Benefits will likely accrue unevenly across cities, industries, and regions rather than showing up clearly at the national level.
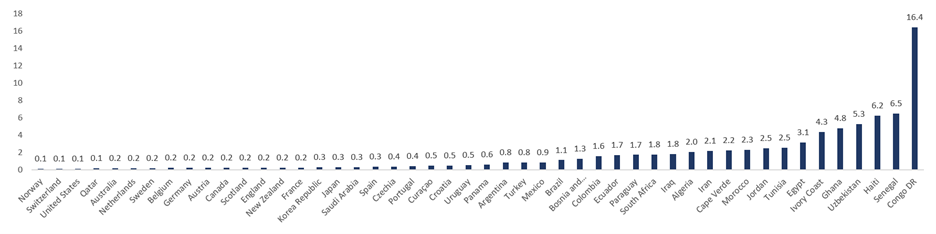
The economics of the 2026 World Cup are also apparent in ticket pricing. Final tickets were initially priced at over $4,000, with premium seats exceeding $10,000 — a sharp increase from prior tournaments. What stands out is not just the absolute price, but the relative affordability across countries. When scaled by income, the cost of attending a final varies dramatically. In higher-income economies, a ticket represents a fraction of annual earnings. In lower-income participating countries, it can equate to multiple years of income (with Congo DR being the outlier at over 16 years of income required for a single ticket) highlighting a significant disparity in access to what is nominally a global event. This dynamic reinforces a broader theme: while the World Cup is global in reach, the economic experience of it is far from uniform.
How Many Years Work to Afford a World Cup Final Ticket
World Cup final cost divided by gross national income (GNI)
Source: LPL Research, FIFA.com, World Bank 06/01/26
GNI per capita data using Atlas Method, current U.S. $, latest available data 2024.
For investors, the takeaway is straightforward: diversification may reduce downside risk, but it also can diffuse potential upside. The 2026 World Cup reflects that tradeoff, less concentrated, more complex, and ultimately more difficult to measure at a national level.
Good luck to our advisors, clients, and all soccer fans whoever you support!
Check out the full update to our World Cup-onomics report, including detailed group-by-group previews, economic comparisons across all 48 nations, and model-based simulated results for both the group stage and knockout rounds. The expanded format introduces greater dispersion across outcomes, both on the pitch and across markets, and provides a unique lens through which to analyze global economic contrasts at scale.
There is no guarantee that a diversified portfolio will enhance overall returns or outperform a non-diversified portfolio. Diversification does not protect against market risk.
Important Disclosures
This material is for general information only and is not intended to provide specific advice or recommendations for any individual. There is no assurance that the views or strategies discussed are suitable for all investors. To determine which investment(s) may be appropriate for you, please consult your financial professional prior to investing.
Investing involves risks including possible loss of principal. No investment strategy or risk management technique can guarantee return or eliminate risk.
Indexes are unmanaged and cannot be invested into directly. Index performance is not indicative of the performance of any investment and does not reflect fees, expenses, or sales charges. All performance referenced is historical and is no guarantee of future results.
This material was prepared by LPL Financial, LLC. All information is believed to be from reliable sources; however LPL Financial makes no representation as to its completeness or accuracy.
Unless otherwise stated LPL Financial and the third party persons and firms mentioned are not affiliates of each other and make no representation with respect to each other. Any company names noted herein are for educational purposes only and not an indication of trading intent or a solicitation of their products or services.
Asset Class Disclosures –
International investing involves special risks such as currency fluctuation and political instability and may not be suitable for all investors. These risks are often heightened for investments in emerging markets.
Bonds are subject to market and interest rate risk if sold prior to maturity.
Municipal bonds are subject and market and interest rate risk and potentially capital gains tax if sold prior to maturity. Interest income may be subject to the alternative minimum tax. Municipal bonds are federally tax-free but other state and local taxes may apply.
Preferred stock dividends are paid at the discretion of the issuing company. Preferred stocks are subject to interest rate and credit risk. They may be subject to a call features.
Alternative investments may not be suitable for all investors and involve special risks such as leveraging the investment, potential adverse market forces, regulatory changes and potentially illiquidity. The strategies employed in the management of alternative investments may accelerate the velocity of potential losses.
Mortgage backed securities are subject to credit, default, prepayment, extension, market and interest rate risk.
High yield/junk bonds (grade BB or below) are below investment grade securities, and are subject to higher interest rate, credit, and liquidity risks than those graded BBB and above. They generally should be part of a diversified portfolio for sophisticated investors.
Precious metal investing involves greater fluctuation and potential for losses.
The fast price swings of commodities will result in significant volatility in an investor’s holdings.
This research material has been prepared by LPL Financial LLC.
Not Insured by FDIC/NCUA or Any Other Government Agency | Not Bank/Credit Union Deposits or Obligations | Not Bank/Credit Union Guaranteed | May Lose Value
For Public Use – Tracking: #1120567
Weekly Market Performance | June 12, 2026
LPL Research
Last Updated: June 12, 2026
LPL Research provides its Weekly Market Performance for the week of June 8, 2026. U.S. equities rebounded modestly from last week’s late-week slide, navigating volatile trading continually shaped by the artificial intelligence (AI) theme and ongoing geopolitical developments. Globally, European stocks advanced on easing energy prices amid a key central bank decision, while Asian markets ended broadly lower. Meanwhile, fixed income markets gained ground with corporate markets slightly outperforming, and commodities declined with a drop in oil in the driver’s seat.
Stock Index Performance
| Index | Week-Ending | One Month | Year to Date |
| S&P 500 | 0.53% | 0.30% | 8.44% |
| Dow Jones Industrial | 0.69% | 2.93% | 6.56% |
| Nasdaq Composite | 0.65% | -0.82% | 11.33% |
| Russell 2000 | 3.95% | 3.61% | 18.67% |
| MSCI EAFE | 2.78% | 1.90% | 9.44% |
| MSCI EM | 5.23% | 3.26% | 24.23% |
S&P 500 Index Sectors
| Sector | Week-Ending | One Month | Year to Date |
| Materials | 3.11% | -0.55% | 13.27% |
| Utilities | 0.27% | -2.03% | 3.62% |
| Industrials | 1.13% | 0.89% | 13.36% |
| Consumer Staples | 2.34% | -0.55% | 10.07% |
| Real Estate | 1.17% | 1.24% | 12.38% |
| Health Care | 0.50% | 5.35% | -0.95% |
| Financials | 1.90% | 3.25% | -2.98% |
| Consumer Discretionary | 0.43% | -3.91% | -2.16% |
| Information Technology | 0.48% | 1.52% | 17.40% |
| Communication Services | -1.81% | -6.10% | 2.85% |
| Energy | -0.33% | -0.62% | 27.03% |
Fixed Income and Commodities
| Indexes and Commodities | Week-Ending | One Month | Year to Date |
| Bloomberg U.S. Aggregate | 0.64% | 0.54% | 0.47% |
| Bloomberg Credit | 0.64% | 0.76% | 0.72% |
| Bloomberg Munis | -0.18% | 0.56% | 1.56% |
| Bloomberg High Yield | 0.31% | 0.47% | 1.58% |
| Oil | -6.77% | -17.39% | 47.00% |
| Natural Gas | -3.28% | 9.85% | -15.27% |
| Gold | -2.61% | -10.59% | -2.40% |
| Silver | 0.13% | -21.44% | -5.22% |
Source: LPL Research, Bloomberg 6/12/26 @3:15 p.m. ET
Disclosures: Indexes are unmanaged and cannot be invested in directly.
U.S. and International Equities
U.S. Equities: After last Friday’s tech-led selloff, major averages gained ground after persevering through another five days of choppy trading across Wall Street. Market narratives remained broadly unchanged, with the largest directional drivers still leading back to AI and geopolitical developments out of Washington and the Middle East. Chipmakers began the week with a healthy rebound, supporting the S&P 500, after chipmaking giant NVIDIA (NVDA) made headlines for its multi-year agreement with Korea’s SK Hynix for new artificial intelligence (AI) memory chips, and reports of Intel (INTC) producing over 3 million chips for Google-parent company Alphabet (GOOG/L). However, the bounce briefly faded until later in the week as still stretched positioning and a ramp in geopolitical rhetoric and kinetic action in the Middle East led investors to rotate toward more economically sensitive pockets of the market.
Markets ended the week with a flurry of headlines, although the broader atmosphere was risk-on despite volatile Friday trading as oil prices fell in response to in hopes of a fresh truce to extend the U.S.-Iran ceasefire and reopen the Strait of Hormuz potentially arriving as soon as this weekend. Simultaneously, market participants monitored the much-anticipated initial public offering (IPO) of SpaceX (SPCX), which began trading late Friday morning.
International Equities: European equities also advanced this week, measured by a healthy gain for the STOXX 600 regional benchmark. Easing crude oil prices and bolstered hopes of a U.S.-Iran agreement were flagged as supportive, but the week’s biggest story came from the European Central Bank’s (ECB) first rate hike since 2023. Citing an uncertain outlook around inflation and economic growth, the rate increase was widely expected by markets — but upward revisions to inflation forecasts and slight reductions to growth projections drew attention, leaving the door open to further hikes this year. Banking shares rose following the decision, but consumer discretionary names broadly led weekly moves on strong earnings from German designer Hugo Boss and a lower-oil price driven rally in travel and leisure names.
Meanwhile, Asian markets faced downside pressure as semiconductor names posted wild swings and gold related names dropped alongside bullion prices. South Korea remained in the spotlight as index-heavyweight chipmakers drove volatile price action in reaction to their U.S. peers, leaving the KOSPI just below the flatline. Japanese stocks faced market chatter around concentration risks in the Nikkei and hotter wholesale inflation data, but trimmed losses on Friday’s tech-led bounce and easing supply chain concerns as oil prices dropped. Greater China was a relative outperformer, with key themes surrounding data suggesting that soft demand kept war-driven producer price increases from passing through to consumers, while tech stocks rose ahead of the SPCX IPO.
Fixed Income, Currency, and Commodity Markets
Fixed Income: Core bonds, as measured by the Bloomberg Aggregate Index, traded higher this week with investment grade (IG) and high-yield (HY) bond markets slightly outperforming. Despite recent volatility in the equity markets, corporate bond markets have remained relatively placid. Corporate credit spreads within both the IG and HY bond markets have barely moved and remain at very low levels. The lack of movement in corporate bond spreads reflects the improved overall quality in both markets in recent years and the fact that, despite increased issuance by technology hyperscalers, the tech sector still represents only about 10% of the IG corporate bond market.
Regarding credit quality, the share of BBB-rated companies (the lowest-rated cohort within the investment-grade universe) continues to decline and now stands at roughly 44%, down from 52% in 2021. Meanwhile, within the HY bond market, BB-rated companies (the highest-rated cohort in the non-investment-grade universe) account for about 56% of the market, up from 46% in 2024. Additionally, there were no payment defaults or distressed exchanges in the HY market during May, which is the first occurrence since August 2018. HY default rates remain very low at 2.02%.
That said, given the higher-quality backdrop and still-elevated yields in both markets, spreads appear unattractive from a tactical perspective (although both markets remain fairly priced relative to our valuation models). However, they remain attractive for income-oriented investors, particularly in the 1–5 year segment of the IG corporate bond market.
Commodities and Currencies: The broader commodity complex traded lower amid fairly steady declines over the last five days. West Texas Intermediate (WTI) crude oil continued to dominate focus across the complex as prices tumbled over 6% to below $90 per barrel (near recent lows) on bolstered hopes that the U.S. and Iran could be close to an interim peace deal. However, prices bounced off the weekly low-water mark as traders remain cautious given significant obstacles will likely linger before oil flows through the Strait of Hormuz normalize. Elsewhere, among metals prices, copper led gains as the potential for a U.S.-Iran deal eased worries around global growth and industrial metals demand. Its precious metal counterparts, gold and silver, struggled to gain traction as the yellow metal fell over 2% while silver edged higher. In currencies, the U.S. Dollar Index dropped as the euro strengthened in response to Thursday’s ECB rate hike, while expectations for a U.S. rate increase ebbed.
Economic Weekly Roundup
Highlights from May CPI Release:
- Core inflation rose 0.2% month over month, keeping the annual rate below the psychological level of 3%.
- The rise in gasoline and other energy commodities pushed headline annual inflation to 4.2%, the highest since mid-2023. Core annual inflation accelerated to 2.9% in May.
- Other than the obvious impact from energy prices, the rise in medical care services is also impacting consumer prices and that’s concerning. But on an encouraging note, health insurance costs have declined year over year for the last 6 months.
- Given the demand for travel, we shouldn’t be surprised by the rising costs of transportation. In addition to demand factors, high fuel costs have also impacted this sector.
Bottom Line: Now that the Iran crisis has extended into June, we have begun to see broader impacts across several categories of consumer prices. If the Strait of Hormuz remains disrupted through the Labor Day weekend, we would expect the energy shock to affect additional sectors and heighten uncertainty about the future path of monetary policy. Rate expectations could be further upended if this crisis lasts throughout the summer. For next week, expect the Fed to remain on hold while removing any bias toward additional easing.
The Week Ahead
The following economic data is slated for the week ahead:
- Monday: Empire Manufacturing (Jun), Industrial and Manufacturing Production (May), Capacity Utilization (May), NAHB Housing Market Index (Jun)
- Tuesday: ADP Weekly Employment Change (May 30), Import and Export Price Indexes (May), New York Fed Services Business Activity (Jun), Housing Starts (May), Building Permits (May preliminary)
- Wednesday: MBA Mortgage Applications (Jun 12), Retail Sales (May), Business Inventories (Apr), Pending Home Sales (May), FOMC Rate Decision
- Thursday: Initial Jobless Claims (Jun 13), Philadelphia Fed Business Outlook (Jun), Continuing Claims (Jun 6), Leading Index (May), Total Net TIC Flows (Apr), Net Long-term TIC Flows (Apr)
- Friday: Juneteenth holiday, no economic releases scheduled
Important Disclosures
This material is for general information only and is not intended to provide specific advice or recommendations for any individual. There is no assurance that the views or strategies discussed are suitable for all investors. To determine which investment(s) may be appropriate for you, please consult your financial professional prior to investing.
Investing involves risks including possible loss of principal. No investment strategy or risk management technique can guarantee return or eliminate risk.
Indexes are unmanaged and cannot be invested into directly. Index performance is not indicative of the performance of any investment and does not reflect fees, expenses, or sales charges. All performance referenced is historical and is no guarantee of future results.
This material was prepared by LPL Financial, LLC. All information is believed to be from reliable sources; however LPL Financial makes no representation as to its completeness or accuracy.
Unless otherwise stated LPL Financial and the third party persons and firms mentioned are not affiliates of each other and make no representation with respect to each other. Any company names noted herein are for educational purposes only and not an indication of trading intent or a solicitation of their products or services.
Asset Class Disclosures –
International investing involves special risks such as currency fluctuation and political instability and may not be suitable for all investors. These risks are often heightened for investments in emerging markets.
Bonds are subject to market and interest rate risk if sold prior to maturity.
Municipal bonds are subject and market and interest rate risk and potentially capital gains tax if sold prior to maturity. Interest income may be subject to the alternative minimum tax. Municipal bonds are federally tax-free but other state and local taxes may apply.
Preferred stock dividends are paid at the discretion of the issuing company. Preferred stocks are subject to interest rate and credit risk. They may be subject to a call features.
Alternative investments may not be suitable for all investors and involve special risks such as leveraging the investment, potential adverse market forces, regulatory changes and potentially illiquidity. The strategies employed in the management of alternative investments may accelerate the velocity of potential losses.
Mortgage backed securities are subject to credit, default, prepayment, extension, market and interest rate risk.
High yield/junk bonds (grade BB or below) are below investment grade securities, and are subject to higher interest rate, credit, and liquidity risks than those graded BBB and above. They generally should be part of a diversified portfolio for sophisticated investors.
Precious metal investing involves greater fluctuation and potential for losses.
The fast price swings of commodities will result in significant volatility in an investor’s holdings.
This research material has been prepared by LPL Financial LLC.
Not Insured by FDIC/NCUA or Any Other Government Agency | Not Bank/Credit Union Deposits or Obligations | Not Bank/Credit Union Guaranteed | May Lose Value
For Public Use – Tracking: #1120629
Taking a Look at Managed Futures
What’s Trending in Managed Futures
Michael McClain | Alternative Investment Research Analyst and Due Diligence
Last Updated: June 09, 2026
Strategy Background
Managed futures strategies, defined as systematic, trend-following funds managed by Commodity Trading Advisors (CTAs), have delivered compelling risk-adjusted returns in the alternatives investment strategy universe through the first half of 2026. The sustained directional moves due to the AI-driven equity rally, Middle East conflict, and stickier inflation have combined to deliver a diversified long/ short trading environment across asset classes. For comparison, a market with limited meaningful trends across asset classes and marked by consistent reversals is often a worse case scenario for the average medium-term trend-follower.
Current Positioning
As of the beginning of June, the managed futures industry has built up several noteworthy positions that current investors should be monitoring:
Equities: Long — But Asymmetrically Risky
Trend-following funds remain net long global equities, with the AI-driven rally in the U.S. driving much of the recent increase in long exposure. The near-term outlook for equity positioning carries notable asymmetry, as a sustained market decline could trigger significant selling pressure, and potentially amplify any drawdown.
Commodities: Energy Trends Continue
Long oil and gold have been the main contributors to returns, however, both markets have declined from recent highs; with gold experiencing a significant move down after briefly breaking through the $5,000 level. Elevated geopolitical risk premiums, central bank demand, dollar weakness, and rising fiscal deficit concerns all provided fundamental tailwinds to the technical trend. A sustained trend across several futures contracts in this sector would provide an attractive source of diversification from the trends in the equity and bond markets.
Fixed Income: Short and Building
There has been a consistent build-up in short bond exposure over the course of the year, as inflation remains above target and any thought of a rate cut has shifted to a rate hike. This is a meaningful change in positioning from where most trend-followers entered the year, and it reflects the degree to which the macro narrative has repriced.
Currencies: Mixed U.S. Dollar Signals
In currencies, trend-following strategies have maintained a short U.S. dollar bias, though the strength of that trend has begun to soften. Long positions in the Australian dollar and Mexican peso versus the dollar have been profitable, while the one consistent long U.S. dollar exposure has been against the yen. The dollar weakness theme has been supported by a combination of fiscal deficit concerns, tariff uncertainty, and a relative growth deceleration narrative that gained traction in Q1 and early Q2. However, with U.S. inflation remaining sticky at elevated levels and the Federal Reserve increasingly hawkish, a dollar stabilization, or partial reversal, is a credible scenario that could pressure the current short book. Currency trend signals tend to be among the slower-moving in a managed futures portfolio, meaning a meaningful shift in dollar direction would take time to generate a signal flip, but investors should be alert to a potential squeeze if the macro backdrop shifts abruptly.
LPL Research Takeaway
Managed futures have offered persistent, cross-asset trends, providing diversification, and delivering compelling returns amid macro uncertainty. The risks, including trend reversals, crowded equities, and potential regime shifts, should be watched as we enter the second half of the year and warrant position-sizing discipline.
As always with systematic strategies, discipline comes not from predicting when trends will end, but from ensuring that risk management frameworks are robust enough to capture the reversal signal without giving back an outsized portion of the gains. We continue to view managed futures as a core diversifier within a well-constructed alternatives sleeve, and the 2026 environment has reinforced rather than undermined that view.
Important Disclosures
This material is for general information only and is not intended to provide specific advice or recommendations for any individual. There is no assurance that the views or strategies discussed are suitable for all investors. To determine which investment(s) may be appropriate for you, please consult your financial professional prior to investing.
Investing involves risks including possible loss of principal. No investment strategy or risk management technique can guarantee return or eliminate risk.
Indexes are unmanaged and cannot be invested into directly. Index performance is not indicative of the performance of any investment and does not reflect fees, expenses, or sales charges. All performance referenced is historical and is no guarantee of future results.
This material was prepared by LPL Financial, LLC. All information is believed to be from reliable sources; however LPL Financial makes no representation as to its completeness or accuracy.
Unless otherwise stated LPL Financial and the third party persons and firms mentioned are not affiliates of each other and make no representation with respect to each other. Any company names noted herein are for educational purposes only and not an indication of trading intent or a solicitation of their products or services.
Asset Class Disclosures –
International investing involves special risks such as currency fluctuation and political instability and may not be suitable for all investors. These risks are often heightened for investments in emerging markets.
Bonds are subject to market and interest rate risk if sold prior to maturity.
Municipal bonds are subject and market and interest rate risk and potentially capital gains tax if sold prior to maturity. Interest income may be subject to the alternative minimum tax. Municipal bonds are federally tax-free but other state and local taxes may apply.
Preferred stock dividends are paid at the discretion of the issuing company. Preferred stocks are subject to interest rate and credit risk. They may be subject to a call features.
Alternative investments may not be suitable for all investors and involve special risks such as leveraging the investment, potential adverse market forces, regulatory changes and potentially illiquidity. The strategies employed in the management of alternative investments may accelerate the velocity of potential losses.
Mortgage backed securities are subject to credit, default, prepayment, extension, market and interest rate risk.
High yield/junk bonds (grade BB or below) are below investment grade securities, and are subject to higher interest rate, credit, and liquidity risks than those graded BBB and above. They generally should be part of a diversified portfolio for sophisticated investors.
Precious metal investing involves greater fluctuation and potential for losses.
The fast price swings of commodities will result in significant volatility in an investor’s holdings.
This research material has been prepared by LPL Financial LLC.
Not Insured by FDIC/NCUA or Any Other Government Agency | Not Bank/Credit Union Deposits or Obligations | Not Bank/Credit Union Guaranteed | May Lose Value
For Public Use – Tracking: #1120564
Weekly Market Commentary | Is Bad News Priced Into the Bond Market? | June 8, 2026
Market adjustments and yields: Fixed income markets have absorbed significant geopolitical and economic developments in recent months, particularly since the escalation of the Iran conflict. Treasury yields have risen sharply, reflecting a combination of higher growth expectations, elevated term premia, and a notable repricing of monetary policy.
Inflation and economic resilience: Yet this adjustment has occurred without a breakout in long-term inflation expectations or a collapse in economic data. This dynamic suggests that a substantial portion of potential bad news — higher-for-longer rates, persistent but contained inflation pressures, and geopolitical risk — may already be embedded in current pricing.
Fed policy and duration outlook: Investors appear to have recalibrated their views on the terminal rate for this cycle and the neutral fed funds rate, moving closer to more hawkish Federal Open Market Committee (FOMC) members’ perspectives. At the same time, stable inflation expectations give the Federal Reserve (Fed) the flexibility to remain on hold rather than react preemptively. This environment supports a cautious — but not outright bearish — outlook for duration, with yields likely past peak levels.
Recent Yield Movements Amid Geopolitical Tensions
Since the onset of the Iran conflict (through last Friday’s close), the U.S. Treasury curve has experienced a meaningful bear flattening with front end yields rising more than back-end yields. The 10-year Treasury yield has increased by approximately 60 basis points (bps), while the 2-year yield has risen by 77 bps. These moves represent a swift repricing that incorporates several factors: rising inflation expectations tied to energy price volatility, an increase in compensation demanded for uncertainty (known as term premia); and a fundamental reassessment of the path for short-term policy rates.
That the increase in yields is not solely a function of inflation fears is important (as discussed later). Market participants have also layered in expectations for stronger real growth in the near term, possibly supported by ongoing investment in the artificial intelligence buildout. Simultaneously, geopolitical risks and fiscal concerns have contributed to higher term premia, reminding investors that rate volatility could remain elevated.
Importantly, these yield increases have been orderly. Despite the geopolitical catalyst, liquidity in core fixed income markets has held up, with no evidence of acute stress in funding markets or forced selling. This resilience underscores that the market is processing information in a measured and efficient way.
To Hike, or Not to Hike, That is the Question
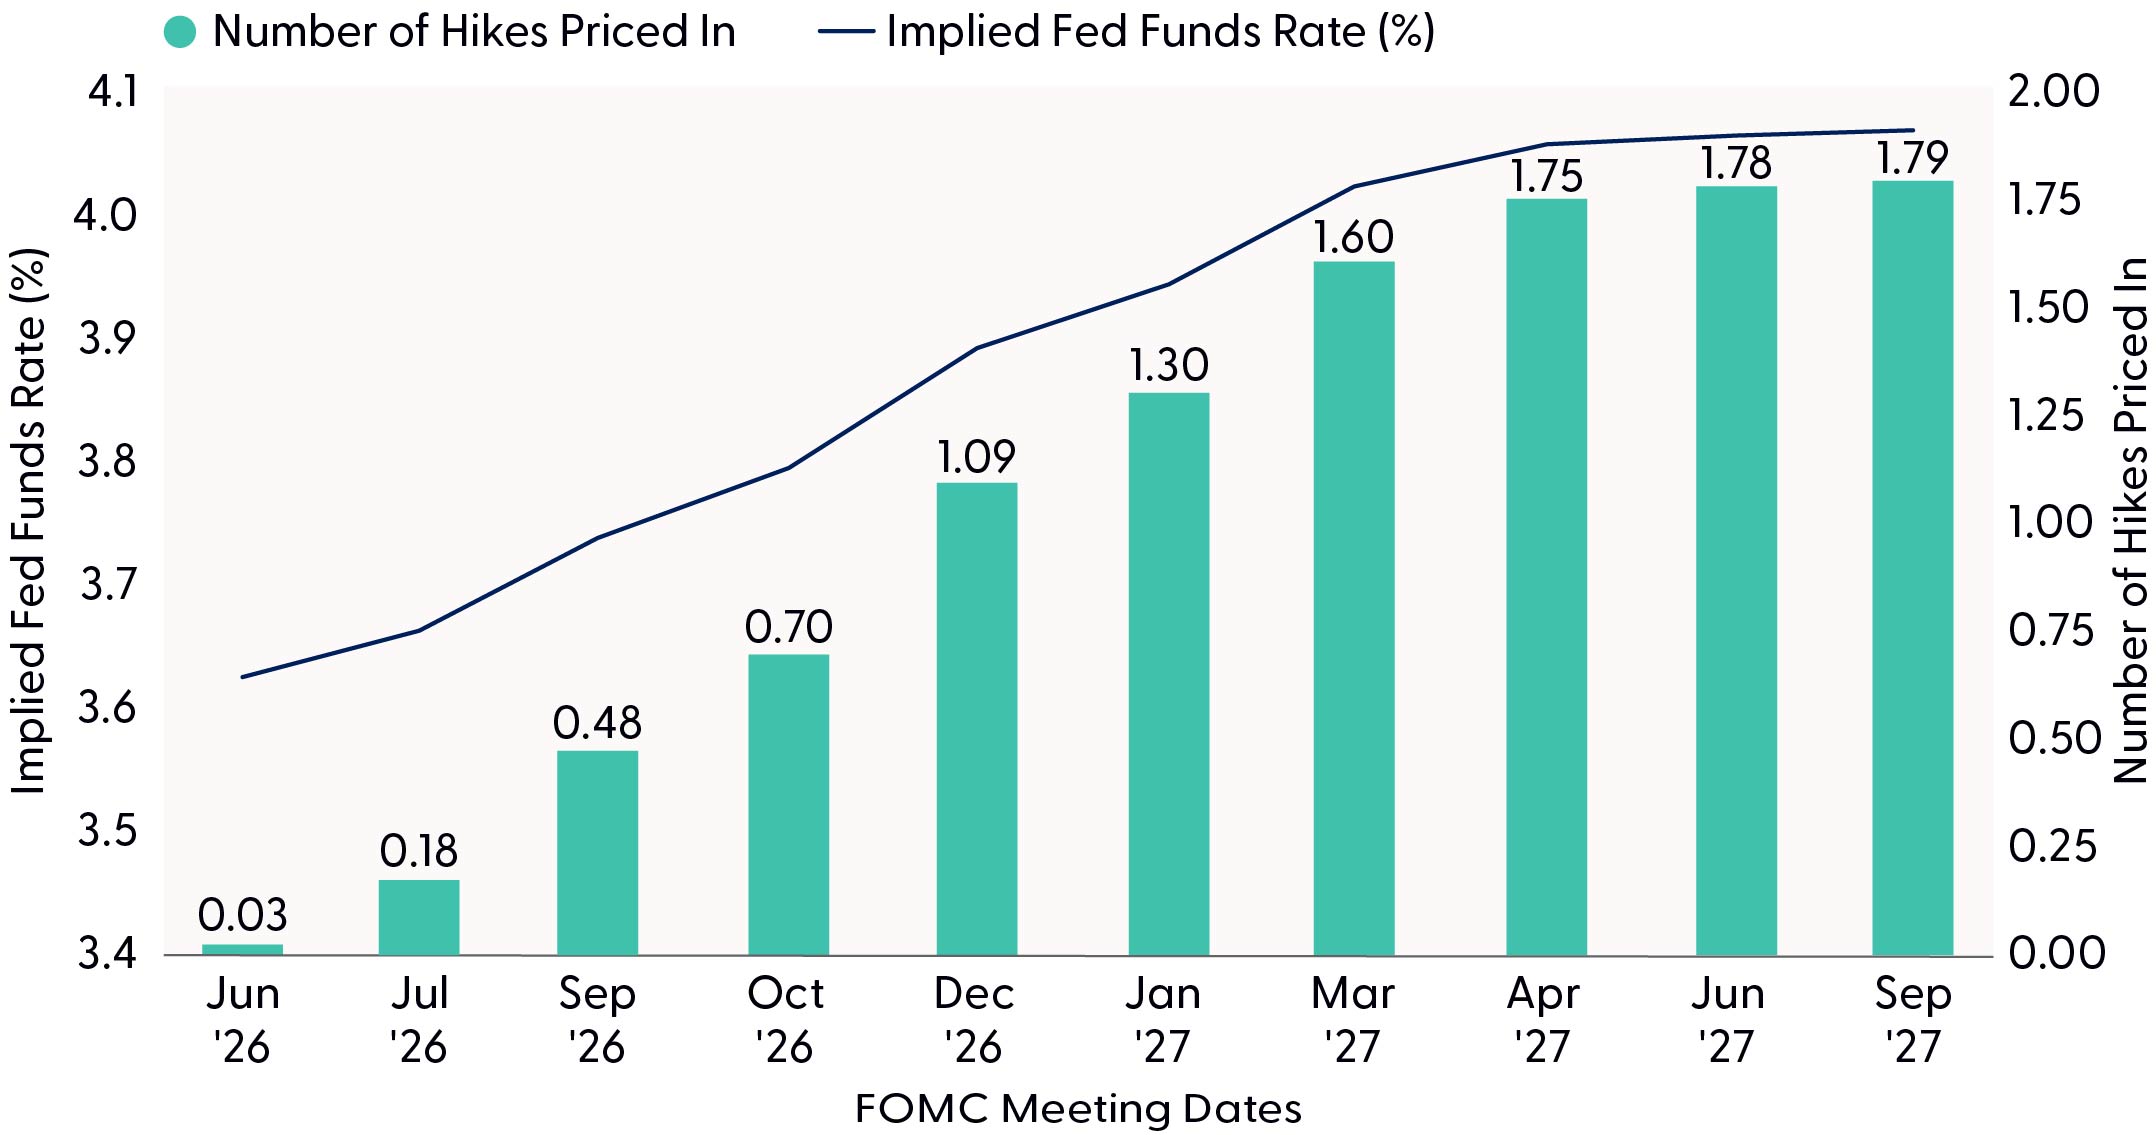
One of the most striking developments has been the rapid shift in expectations for Fed policy. After last Friday’s stronger than expected jobs report, markets are now pricing in roughly a 100% probability of a rate hike sometime this year, with a 67% chance of two hikes by June 2027. This marks a sharp reversal from earlier in 2026, when investors were expecting multiple rate cuts.
The implied neutral fed funds rate has been revised higher to around 4%, bringing market pricing closer in line with more hawkish FOMC member views than with the previous median expectation. Even Fed Governor Chris Waller, often viewed as a relative dove, has publicly acknowledged that a rate hike may be warranted under certain conditions. This signals that the Fed’s policy optionality is flexible: policymakers retain the ability to hike if data warrant it, but it is not compelled to do so unless the inflation outlook deteriorates.
Markets Have Priced in a Full Fed Rate Hike by December 2026
Source: LPL Research, Bloomberg 06/05/26
Disclosures: Past performance is no guarantee of future results.
This repricing reflects a maturation of market thinking. Rather than assuming the post-pandemic cycle would mirror previous easing cycles with a low neutral rate, investors now appear to accept a structurally higher rate environment. Resilient labor markets, sticky services inflation, and recognition that productivity gains or demographic shifts may have modestly increased the long-term equilibrium real rate support this view. That said, we’re still of the view that the Fed can potentially cut rates once this year (likely December), but this certainly depends on the depth and duration of the Iran conflict/oil prices, which remain the biggest challenge to cuts. We don’t agree with market pricing suggesting a hike is likely this year as the bar for a hike is much higher than a Fed on hold for an extended period of time. So, with Fed officials generally more hawkish, the question becomes have they increased their hawkish rhetoric to help tighten financial conditions (aimed at staving off a hike) or is there a real chance the next move could be a rate hike? Time will tell, but the Fed arguably isn’t behind the curve, as in 2022.
The Fed Can Be Patient…For Now
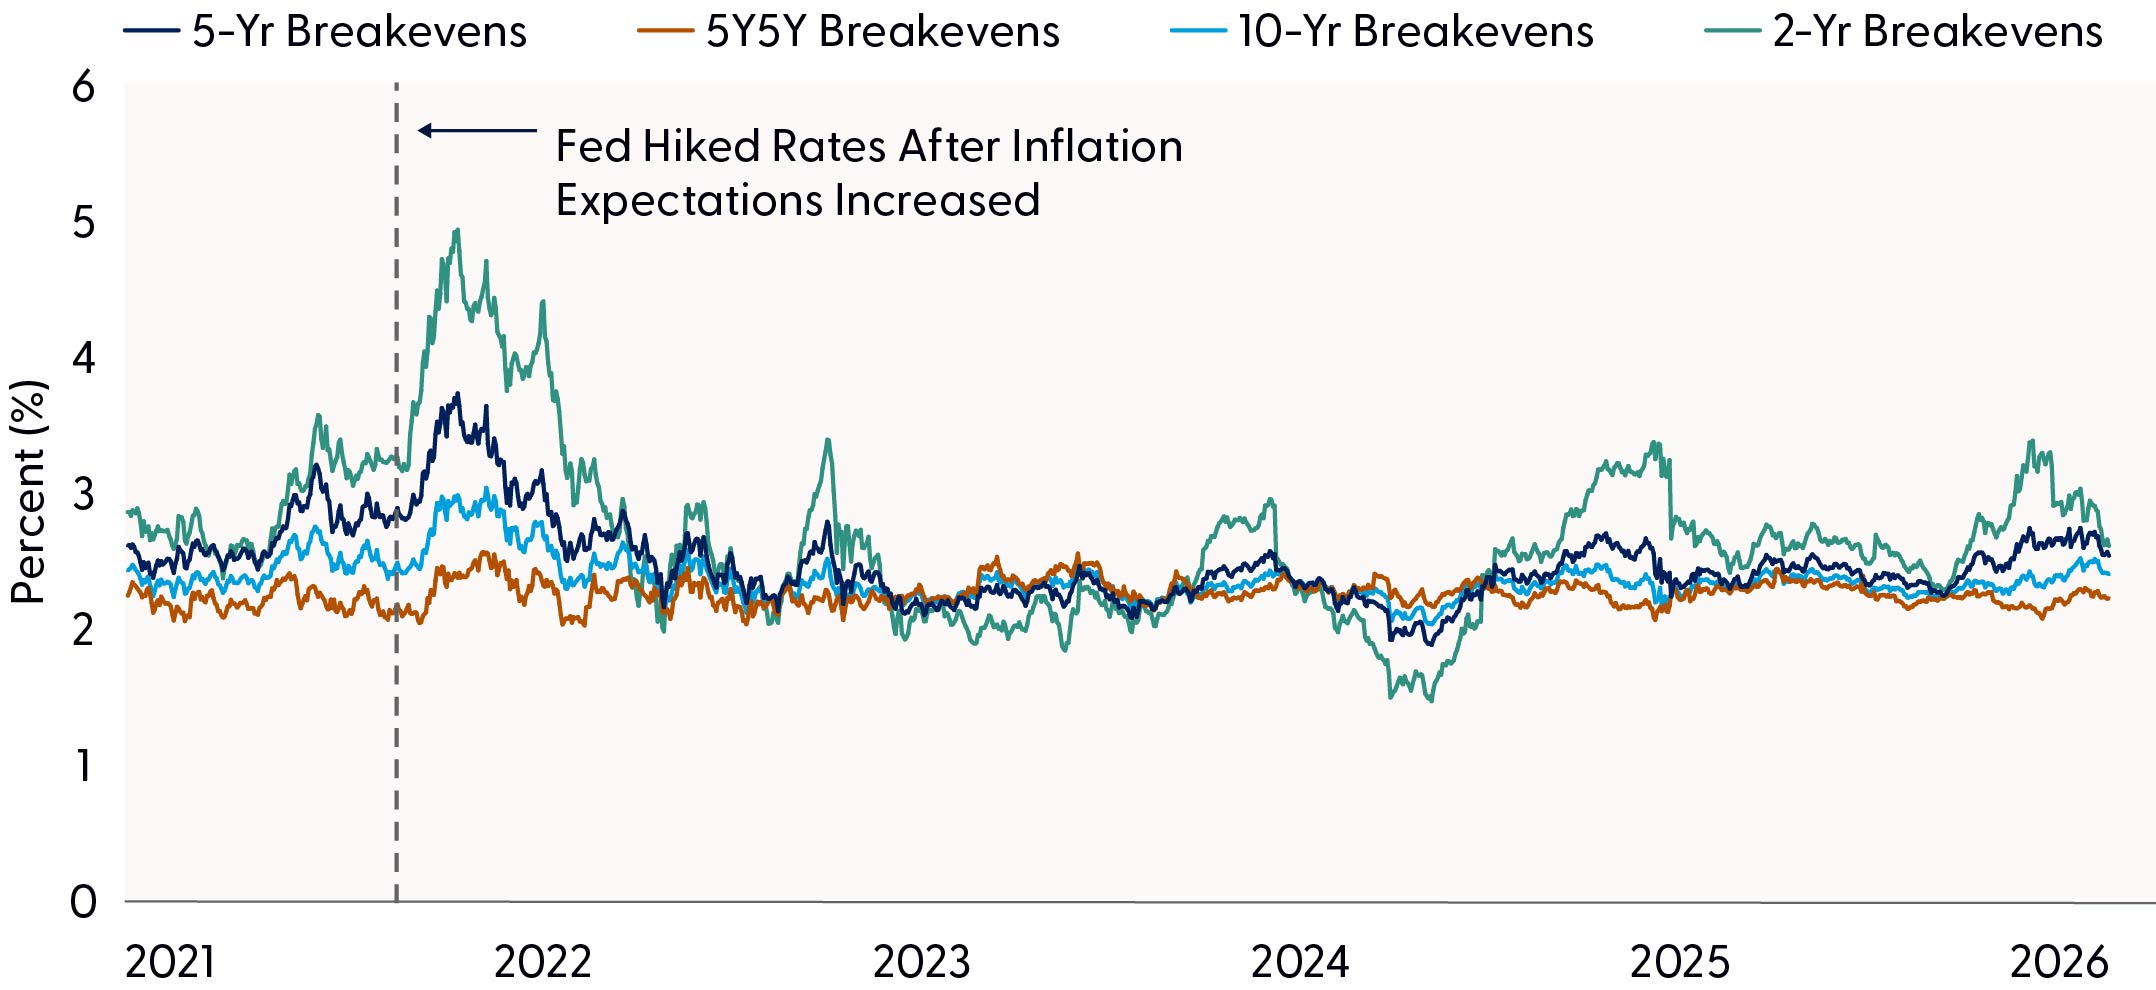
Despite the front-end repricing and near-term inflation risks from energy markets, long-run inflation expectations remain well anchored. This is a critical distinction: near-term inflation pressures from geopolitical events are being viewed as transitory, while structural price stability expectations remain firm.
This anchoring is a key reason why the Fed can remain patient. Unlike the 2022 experience, when the central bank was clearly behind the curve and inflation expectations were rising alongside actual inflation, markets today appear prepared to “look through” temporary price spikes. For example, breakevens have moved modestly higher but remain consistent with modest overshoots of the Fed’s 2% target rather than a sustained shift higher. Forward inflation swaps and longer-dated breakevens reinforce this view.
The Fed’s credibility, rebuilt through its aggressive tightening in 2022–2023 and subsequent data-dependent approach, provides a buffer. As long as expectations stay anchored, the bar for an actual rate hike remains relatively high, even if markets are pricing in some probability of one — reducing worst-case-scenario risks and supporting the case that much of the bad news on inflation is likely already priced in (absent a reacceleration in oil prices).
Unlike in 2022, Inflation Expectations Remain Well Anchored
Source: LPL Research, Bloomberg 06/01/26
Disclosures: Past performance is no guarantee of future results.
Higher Yields: A Mix of Inflation and Real Growth Expectations
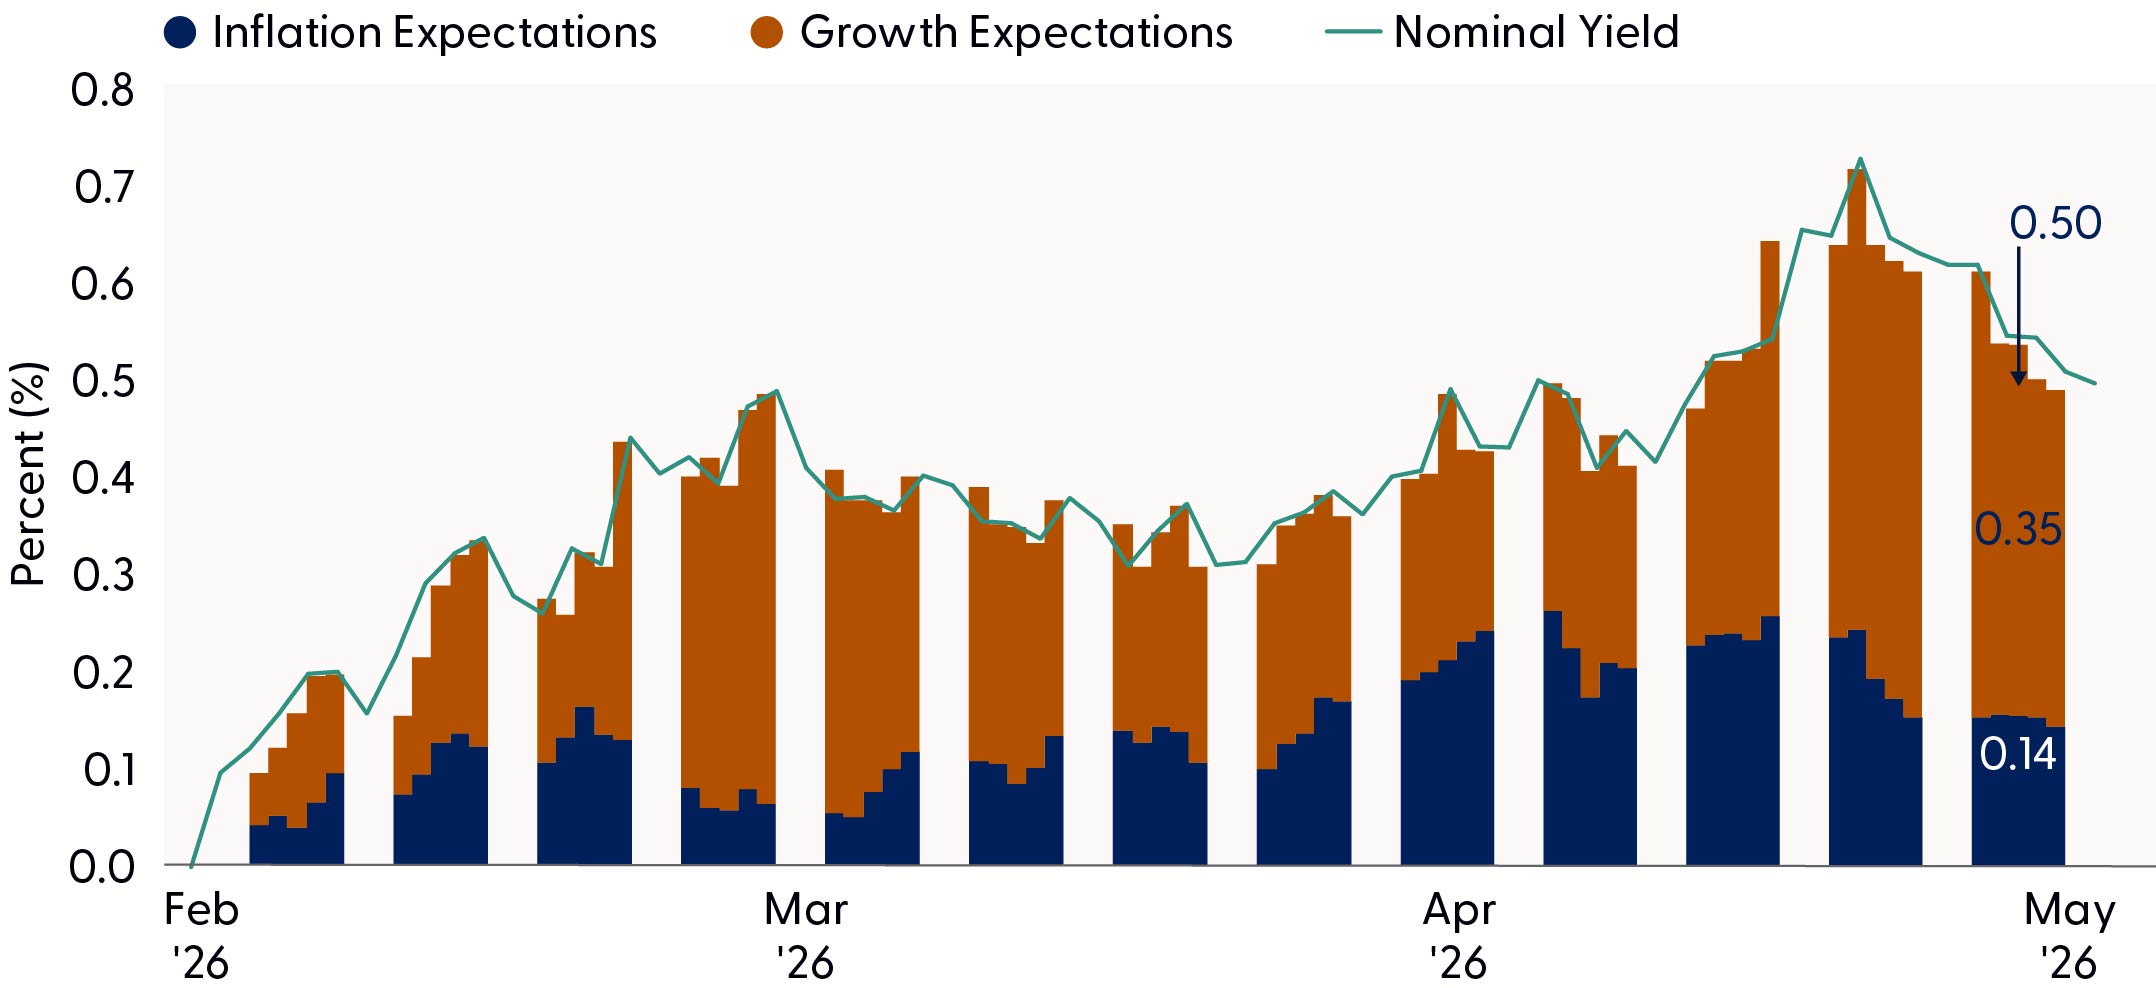
Nominal Treasury yields can be decomposed into components reflecting real growth expectations and inflation compensation. Analyzing the move in the 10-year yield since the start of the Iran conflict shows that the majority of the increase (approximately 35 bps) stems from rising growth expectations, with a smaller portion (only about 14 bps) tied to higher inflation expectations.
This is an important distinction. The growth-driven component suggests markets are pricing in a “soft landing plus” scenario or at least continued economic resilience rather than outright stagflation. Higher real rates reflect confidence in growth, likely supported by productivity or fiscal stimulus effects.
Consequently, even if oil prices decline after geopolitical uncertainty eases, any meaningful drop in the 10-year yield may be limited unless economic data warrants a deeper than expected rate-cutting cycle. Yields have risen on the back of better-than-feared growth, not runaway inflation — a distinction that matters for the trajectory of rate volatility going forward.
10-Year Nominal Yield Broken Out by Inflation and Growth Drivers
Source: LPL Research, Bloomberg 06/05/26
Disclosures: Past performance is no guarantee of future results.
Resilient Data, Steady Demand
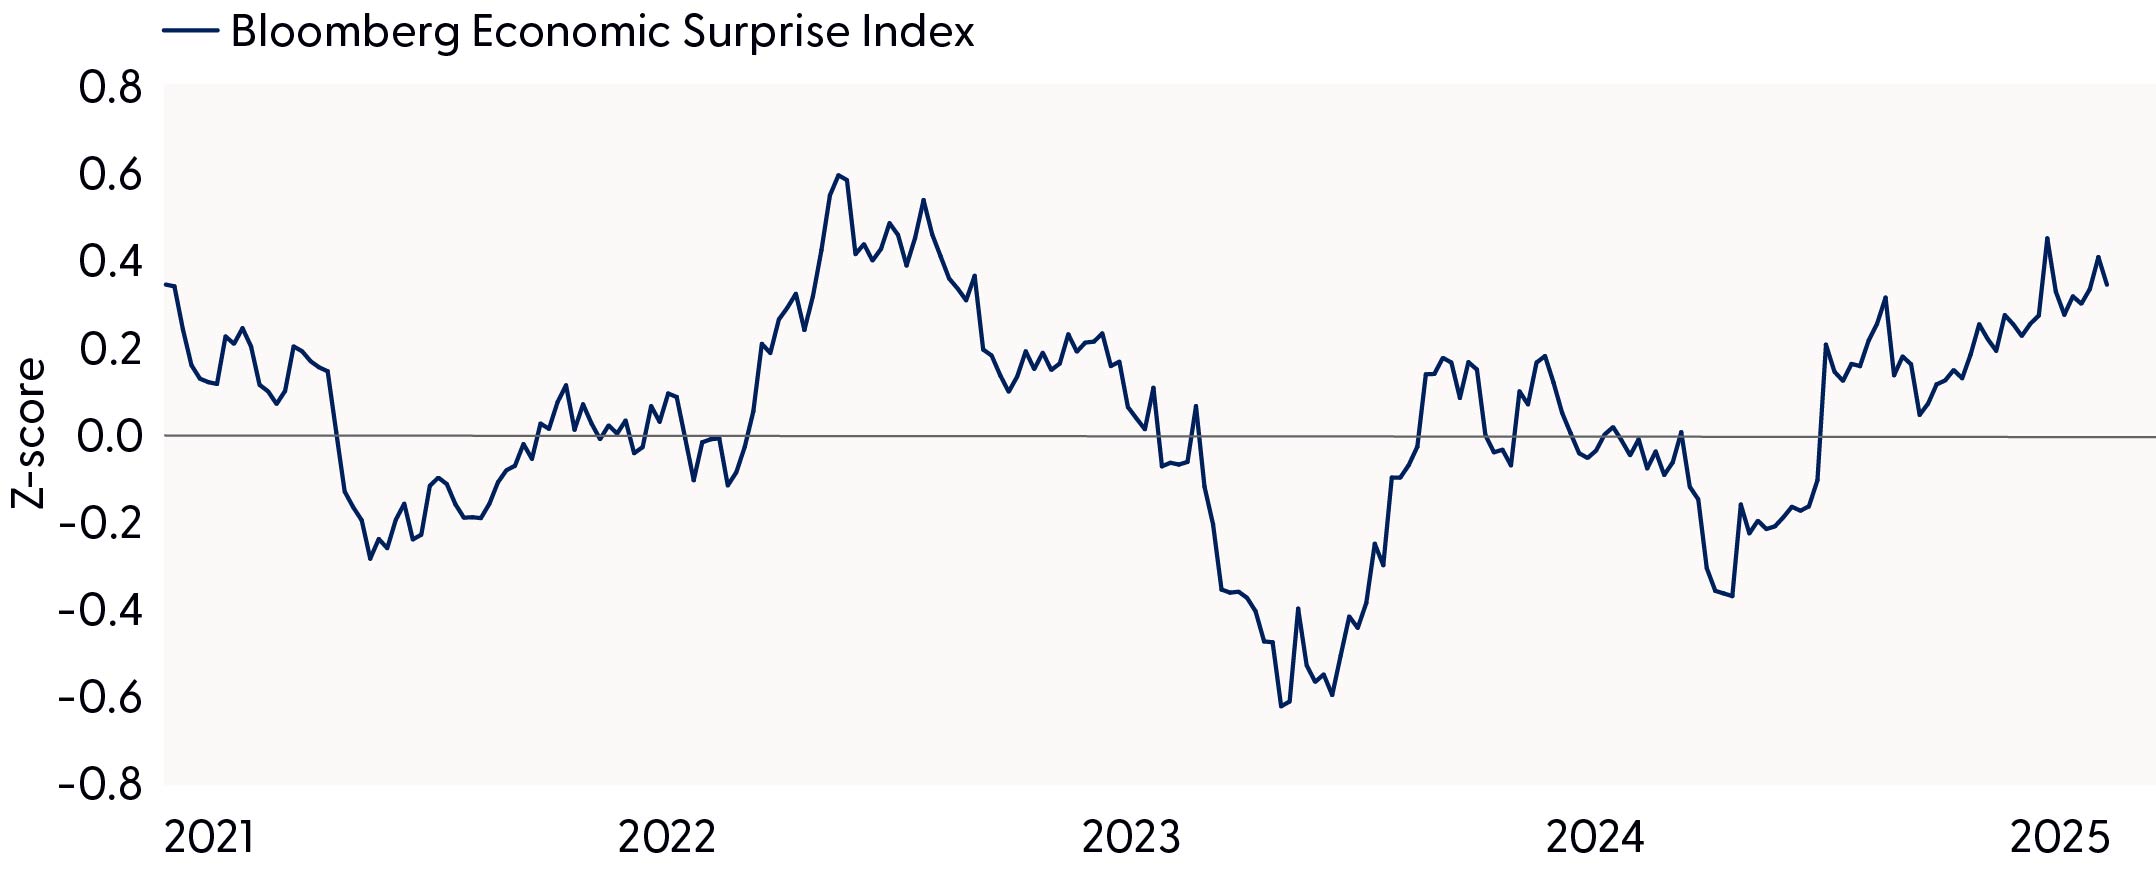
Recent macroeconomic data and Treasury auctions reinforce the view that markets have absorbed bad news well. Incoming data has generally surprised to the upside (per the Bloomberg Economic Surprise Index), demonstrating economic momentum that has exceeded consensus expectations in several areas, helping keep the broader narrative of resilience intact.
Economic Data Has Been Better Than Expected Recently
Source: LPL Research, Bloomberg 06/01/26
Disclosures: All indexes are unmanaged and cannot be invested in directly. Past performance is no guarantee of future results.
Also, recent auctions of 2-year, 5-year, and 7-year Treasuries, totaling $183 billion, were met with adequate demand. While not exceptionally strong, they were far from weak. Foreign participation and domestic investor interest proved sufficient to absorb supply without pushing yields significantly higher intra-auction. This suggests that investors are reasonably comfortable with prevailing yield levels. In combination, both factors underpin the case that current yields reflect a balanced assessment of risks rather than panic pricing. This week’s $119 billion (total) in Treasury auctions of 3-year, 10-year, and 30-year Treasury securities will provide another real time test to determine if yields are sufficient to attract necessary demand.
Conclusion
The Treasury market has priced in a potential rate hike, reset the neutral rate higher, and built in a meaningful term premium — all while long-run inflation expectations remain anchored and macroeconomic data have held up. A substantial amount of bad news appears to already be reflected in prices. Absent a resurgence in oil prices or a sharp acceleration in growth, the recent surge in yields is likely behind us, although longer-maturity Treasury yields should remain elevated near current levels in the near term, in our view.
In summary, fixed income markets have demonstrated remarkable efficiency in incorporating geopolitical shocks and policy repricing. With much of the adjustment likely already behind us, the risk-reward profile for core Treasuries appears more balanced than headline yield moves might suggest.
Asset Allocation Insights
LPL’s Strategic and Tactical Asset Allocation Committee (STAAC) maintains a neutral stance on duration relative to benchmarks. Our proprietary duration models show mixed signals, pointing toward neutral positioning, which strikes the appropriate balance. We would reconsider and potentially add duration if the 10-year yield were to push into the 4.75–5.00% range or if the curve steepened materially from current levels, which would represent an attractive entry point given the anchored expectations backdrop.
The STAAC maintains its recommendation for a tactical equity overweight and fixed income underweight. This reflects an expectation of further easing of geopolitical and commodity supply concerns as a result of the U.S.-Iran conflict, alongside a more cautious outlook for select areas of core fixed income. Overall, our tactical views emphasize a modest equity overweight expressed via a defensive factor tilt, a continued focus on quality bond sectors, caution in rate‑sensitive fixed income sectors, and an ongoing allocation to diversifying strategies and alternatives. Within fixed income sectors, we remain underweight investment grade corporates and mortgage-backed securities (MBS) as spreads remain tight relative to historical standards, diminishing the risk/reward profile of the sectors.
Important Disclosures
This material is for general information only and is not intended to provide specific advice or recommendations for any individual. There is no assurance that the views or strategies discussed are suitable for all investors or will yield positive outcomes. Investing involves risks including possible loss of principal. Any economic forecasts set forth may not develop as predicted and are subject to change.
References to markets, asset classes, and sectors are generally regarding the corresponding market index. Indexes are unmanaged statistical composites and cannot be invested into directly. Index performance is not indicative of the performance of any investment and do not reflect fees, expenses, or sales charges. All performance referenced is historical and is no guarantee of future results.
Any company names noted herein are for educational purposes only and not an indication of trading intent or a solicitation of their products or services. LPL Financial doesn’t provide research on individual equities.
All information is believed to be from reliable sources; however, LPL Financial makes no representation as to its completeness or accuracy.
All investing involves risk, including possible loss of principal.
US Treasuries may be considered “safe haven” investments but do carry some degree of risk including interest rate, credit, and market risk. Bonds are subject to market and interest rate risk if sold prior to maturity. Bond values will decline as interest rates rise and bonds are subject to availability and change in price.
The Standard & Poor’s 500 Index (S&P500) is a capitalization-weighted index of 500 stocks designed to measure performance of the broad domestic economy through changes in the aggregate market value of 500 stocks representing all major industries.
The PE ratio (price-to-earnings ratio) is a measure of the price paid for a share relative to the annual net income or profit earned by the firm per share. It is a financial ratio used for valuation: a higher PE ratio means that investors are paying more for each unit of net income, so the stock is more expensive compared to one with lower PE ratio.
Earnings per share (EPS) is the portion of a company’s profit allocated to each outstanding share of common stock. EPS serves as an indicator of a company’s profitability. Earnings per share is generally considered to be the single most important variable in determining a share’s price. It is also a major component used to calculate the price-to-earnings valuation ratio.
All index data from FactSet or Bloomberg. All index data from FactSet or Bloomberg.
This research material has been prepared by LPL Financial LLC.
Not Insured by FDIC/NCUA or Any Other Government Agency | Not Bank/Credit Union Guaranteed | Not Bank/Credit Union Deposits or Obligations| May Lose Value
For public use.
Member FINRA/SIPC.
RES-0007122-0526 Tracking #1120258 | #1120259 (Exp. 06/2027)
Weekly Market Performance | June 5, 2026
LPL Research
Last Updated: June 05, 2026
LPL Research provides its Weekly Market Performance for the week of June 1, 2026. Stocks started June on a volatile footing, ending Wall Street’s nine-week winning streak amid a mix of geopolitical tensions, shifting interest rate expectations, and cooling artificial intelligence (AI) driven momentum. U.S. equities initially pushed to new highs on tech strength but reversed as rising oil prices, higher Treasury yields, and disappointing corporate forecasts (relative to high expectations) dampened sentiment. International markets followed a similar pattern, with Europe pressured by weaker economic data and rate hike speculation, and Asia weighed down by fading tech optimism. Meanwhile, bond yields climbed on stronger-than-expected economic data, and commodities were mixed.
Stock Index Performance
| Index | Week-Ending | One Month | Year to Date |
| S&P 500 | -2.72% | 1.58% | 7.72% |
| Dow Jones Industrial | -0.30% | 3.20% | 5.86% |
| Nasdaq Composite | -4.49% | 1.72% | 10.84% |
| Russell 2000 | -3.38% | -0.86% | 13.65% |
| MSCI EAFE | -2.68% | -0.05% | 6.21% |
| MSCI EM | -6.05% | -1.45% | 17.80% |
S&P 500 Index Sectors
| Sector | Week-Ending | One Month | Year to Date |
| Materials | -1.41% | -2.01% | 9.67% |
| Utilities | -0.41% | -4.94% | 3.24% |
| Industrials | 0.37% | 0.65% | 11.87% |
| Consumer Staples | 1.22% | -1.80% | 7.84% |
| Real Estate | 1.74% | 1.26% | 11.32% |
| Health Care | 2.32% | 5.13% | -1.43% |
| Financials | 1.18% | 1.08% | -4.91% |
| Consumer Discretionary | -6.20% | -4.37% | -2.58% |
| Information Technology | -4.97% | 7.05% | 17.40% |
| Communication Services | -4.52% | -5.12% | 4.08% |
| Energy | 2.82% | -3.10% | 27.89% |
Fixed Income and Commodities
| Indexes and Commodities | Week-Ending | One Month | Year to Date |
| Bloomberg U.S. Aggregate | -0.11% | 0.22% | 0.26% |
| Bloomberg Credit | -0.12% | 0.48% | 0.55% |
| Bloomberg Munis | 0.46% | 0.83% | 1.81% |
| Bloomberg High Yield | -0.11% | 0.35% | 1.57% |
| Oil | 3.24% | -11.81% | 57.07% |
| Natural Gas | -2.34% | 15.24% | -12.83% |
| Gold | -4.79% | -5.14% | 0.07% |
| Silver | -9.49% | -6.45% | -4.90% |
Source: LPL Research, Bloomberg 6/5/26 @3:35 p.m. ET
Disclosures: Indexes are unmanaged and cannot be invested in directly.
U.S. and International Equities
U.S. Equities: Five days of relatively choppy trading left Wall Street on track to snap a historic nine-week winning streak. After closing out strong monthly gains for May, the S&P 500 faced a few moving pieces to start the month of June between a ramp in hostilities in the Middle East and crosscurrents in the AI theme. Early in the week, major averages picked up right where they left off last month, scoring with fresh records on the back of tech shares in response to NVIDIA (NVDIA) CEO Jensen Huang announcing the chipmaking giant’s move into the PC market, while also dismissing software disruption concerns. However, rising oil prices and Treasury yields placed an overhang on equities on renewed negotiation uncertainty and a brief escalation in Israeli-Hezbollah hostilities in Lebanon, while U.S.-Iran strikes tested the temporary ceasefire again.
Nonetheless, corporate updates may have been the biggest directional driver. Shares of Alphabet (GOOG/L) dropped after the Google-parent company announced an $80 billion equity raise to fund AI spending plans. In the following sessions, chipmakers succumbed to downside pressure after their outsized rally in response to semiconductor maker Broadcom’s (AVGO) revenue forecast falling just shy of Wall Street’s lofty expectations — sparking concerns that the latest AI rally may have run too hard. Stocks went on to end the week on a risk-off note as a result of the colliding dynamics, with additional pressure from rate hike expectations after May payrolls data cruised past consensus forecasts.
International Equities: The STOXX 600 European regional index ended modestly lower as rising crude prices kept a lid on risk taking to start the month of June. Among regional headlines, hawkish-leaning European Central Bank commentary combined with flash consumer inflation data indicating accelerating price pressures last month, broadly dampened sentiment. Investors also assessed a fresh potential headwind from a proposed 10% U.S. levy on imports from the U.K. and the European Union. Elsewhere, consumer discretionary names outperformed on positive consumer spending takeaways from earnings reports, while the heavyweight banking sector lagged after multiple institutions reportedly suspended account opening for mainland China clients as a part of regulators’ cross-border crackdown.
On the other side of the globe, major Asian markets ended mostly lower. South Korea led declines as dented AI sentiment on Friday poured cold water on the KOSPI’s red-hot chip-fueled rally, wiping out weekly gains. Moves elsewhere were more measured in comparison. Taiwan edged higher despite Friday’s selling, while Japanese benchmarks ended mixed as the Nikkei clung to mid-week tech gains and the Topix ticked lower as U.S.-Iran deal uncertainty continued to weigh on exporters. Greater China reversed gains driven by tech excitement for Tencent’s potential AI agent for the popular WeChat service after the project met regulatory hurdles, while banks dropped on developments in authorities’ cross-border crackdown.
Fixed Income, Currency, and Commodity Markets
Fixed Income: Core bonds, as measured by the Bloomberg Aggregate Index, traded lower this week. Within Treasury markets, the week was bookended by a rise in yields as the curve generally continued to be directionally driven by rising oil prices amid flaring tensions around the Middle East. However, despite crude prices cooling heading into the weekend, Friday’s Treasury selloff was particularly notable as shorter-dated yields jumped as much as 13 basis points (0.13%) as market pricing for Federal Reserve (Fed) rate hikes received a jolt from much stronger than expected May payrolls data. Rate hike expectations in global markets also continued to underpin yields. In our view, given that longer-term inflation expectations remain well anchored, the Fed is not likely behind the curve. While market pricing for a potential rate hike received another boost Friday, the bar for central bankers to tighten monetary policy is likely higher than it appears, and market pricing in the Treasury market may currently be too hawkish.
Commodities and Currencies: The broader commodity complex traded lower, erasing fairly muted weekly gains on Friday. With geopolitical tensions in the Persian Gulf and U.S.-Iran peace talks still front and center across asset classes, crude oil prices continued to dominate headlines for the complex. West Texas Intermediate (WTI) printed a healthy advance in response to clashes in the Middle East — even after trimming gains to end the week on remarks from Washington that negotiations with Tehran are progressing well. But Friday’s losses were limited as investors still await concrete progress, and the Strait of Hormuz remains closed. While oil was still the focal point for market chatter, a drop in precious metals weighed on the complex. Gold deepened weekly losses as a potential rate hike would pose a headwind for the non-yielding yellow metal, while silver posted even sharper losses. In currencies, the U.S. dollar index rallied back near 100 into the weekend on rate hike speculation while the euro weakened as investors flocked to the greenback.
Economic Weekly Roundup
Highlights from Friday’s Payrolls Report
- Job demand was especially strong in healthcare and leisure and hospitality sectors. Payrolls contracted in residential construction, financial services, and retail trade.
- Payroll activity was mixed in May as retail trade shed workers across most subcategories. But relative to longer trends, retailers have kept payrolls stable at roughly 15.5 million across the country.
- The unemployment rate was unchanged at 4.3% and remained in a narrow range of 4.3% to 4.5% since mid-2025.
- The labor force participation rate held at 61.8% in May, and the employment-population ratio changed little at 59.2%. These measures showed little change over the year, after accounting for annual population control adjustments.
- Financial activities employment declined by 22,000 in May and is down by 107,000 since a recent peak in May 2025.
- Over the year, average hourly earnings have increased by 3.4%, not quite the pace of inflation in recent months. We could expect impacts from energy market volatility to seep into labor demand if the effects of the Iran conflict linger through the summer.
- Bottom Line: Most indicators are rangebound as the labor market holds steady. If we stay in this low-hire, low-fire environment, we should expect unemployment to be range bound. However, if we see a slowdown in sales and business activity like we expect next quarter, we should expect unemployment to tick upward.
Beige Book Gives Mixed Signals. The May 2026 installment, one of eight Federal Reserve Beige Book editions scheduled for this year, is becoming increasingly valuable as central bankers struggle to form a reasonable outlook for the economy.
- Wage growth is largely in line with inflation, giving consumers the ability to keep up with price changes, at least for the time being.
- Data center demand is supporting hirings. Outside that category, the broad job market remains in a low-hire, low-fire environment.
- Firms are temporarily absorbing higher input costs to preserve customer demand. This occurs when businesses believe the consumer is on weaker footing.
- Although delinquencies have mostly remained stable, several contacts reported early signs of deterioration.
Bottom Line: We may be at a crossroads, as credit conditions appear to be weakening. Although the economy continues to perform well, certain variables remain too fragile to withstand additional geopolitical shocks beyond what they have already endured. Business investment will likely keep the economy growing 1.8% annualized in Q2 and the upcoming jobs report will likely show firms added 50,000 to their payrolls. One growing concern is the rising unemployment rate for workers with minimal experience.
The Week Ahead
The following economic data is slated for the week ahead:
- Monday: New York Fed One-Year Inflation Expectations (May)
- Tuesday: NFIB Small Business Optimism (May), ADP Weekly Employment Change (May 23), Trade Balance (Apr), Existing Home Sales (May), Wholesale Inventories (Apr final), Wholesale Trade Sales (Apr)
- Wednesday: MBA Mortgage Applications (June 5), Headline and Core CPI (May), Real Average Hourly Earnings (May), Federal Budget Balance (May)
- Thursday: Initial Jobless Claims (Jun 6), Continuing Claims (May 30), Headline and Core PPI (May), Household Change in Net Worth (1Q)
- Friday: University of Michigan Consumer Sentiment Report (June preliminary)
Important Disclosures
This material is for general information only and is not intended to provide specific advice or recommendations for any individual. There is no assurance that the views or strategies discussed are suitable for all investors. To determine which investment(s) may be appropriate for you, please consult your financial professional prior to investing.
Investing involves risks including possible loss of principal. No investment strategy or risk management technique can guarantee return or eliminate risk.
Indexes are unmanaged and cannot be invested into directly. Index performance is not indicative of the performance of any investment and does not reflect fees, expenses, or sales charges. All performance referenced is historical and is no guarantee of future results.
This material was prepared by LPL Financial, LLC. All information is believed to be from reliable sources; however LPL Financial makes no representation as to its completeness or accuracy.
Unless otherwise stated LPL Financial and the third party persons and firms mentioned are not affiliates of each other and make no representation with respect to each other. Any company names noted herein are for educational purposes only and not an indication of trading intent or a solicitation of their products or services.
Asset Class Disclosures –
International investing involves special risks such as currency fluctuation and political instability and may not be suitable for all investors. These risks are often heightened for investments in emerging markets.
Bonds are subject to market and interest rate risk if sold prior to maturity.
Municipal bonds are subject and market and interest rate risk and potentially capital gains tax if sold prior to maturity. Interest income may be subject to the alternative minimum tax. Municipal bonds are federally tax-free but other state and local taxes may apply.
Preferred stock dividends are paid at the discretion of the issuing company. Preferred stocks are subject to interest rate and credit risk. They may be subject to a call features.
Alternative investments may not be suitable for all investors and involve special risks such as leveraging the investment, potential adverse market forces, regulatory changes and potentially illiquidity. The strategies employed in the management of alternative investments may accelerate the velocity of potential losses.
Mortgage backed securities are subject to credit, default, prepayment, extension, market and interest rate risk.
High yield/junk bonds (grade BB or below) are below investment grade securities, and are subject to higher interest rate, credit, and liquidity risks than those graded BBB and above. They generally should be part of a diversified portfolio for sophisticated investors.
Precious metal investing involves greater fluctuation and potential for losses.
The fast price swings of commodities will result in significant volatility in an investor’s holdings.
This research material has been prepared by LPL Financial LLC.
Not Insured by FDIC/NCUA or Any Other Government Agency | Not Bank/Credit Union Deposits or Obligations | Not Bank/Credit Union Guaranteed | May Lose Value
For Public Use – Tracking: #1116034
Oil Market May Be Too Constructive on U.S.-Iran Deal
Oil Market Underestimates Frictions Beyond a Deal
Kristian Kerr | Head of Macro Strategy
Last Updated: June 04, 2026
For weeks now, media reports have been suggesting that Washington and Tehran are moving closer to a memorandum of understanding (MOU). In practical terms, that would extend the current ceasefire by roughly 60 days and create a window to negotiate a more durable peace agreement. The market’s constructive read is straightforward: an MOU should allow flows through the Strait of Hormuz to stabilize quickly, if not normalize outright very soon.
We think that interpretation is a bit too linear. Even if an MOU is signed, it does not automatically translate into an immediate surge in oil supply. The more realistic near-term path is incremental. Any early increase in barrels is likely to come from already-produced crude, including crude sitting on stranded or floating vessels and Iranian cargoes in storage, rather than a sustained restart in production or exports. In other words, this is more about clearing existing bottlenecks than reflating the supply base. At the same time, the market appears to be underestimating the logistical challenges. Tankers have been repositioned globally over the past two months, insurance premia have adjusted materially higher, and operational risk remains elevated. Getting flows back up is not as simple as flipping a switch. Shipowners and insurers will need clarity that vessels can safely transit into and out of the region before meaningfully committing capacity. With residual risks around mines, miscalculation, or a relapse in hostilities, that confidence is unlikely to be rebuilt overnight.
Bigger picture, a more meaningful and sustained recovery in supply likely requires something far more comprehensive than an interim MOU. A full agreement between the U.S. and Iran remains a high bar, with clear gaps still in place across core issues like nuclear constraints, sanctions relief architecture, and the longer-term framework governing transit through Hormuz. These are complex, interconnected issues, and even under best-case assumptions, they are unlikely to be resolved quickly. Realistically, the process could absorb much, if not all, of the proposed 60-day window, pushing us closer to peak summer driving season in the U.S. Crucially, the negotiation phase is unlikely to be smooth. The same complexity that makes a final deal so difficult to achieve also increases the risk of periodic setbacks or flare-ups along the way. Markets tend to discount outcomes; they are less efficient at pricing path dependency. Here, the path matters as any disruption will quickly affect sentiment and flows.
Cushing Inventories on Track to Reach Critical Lows Within Weeks
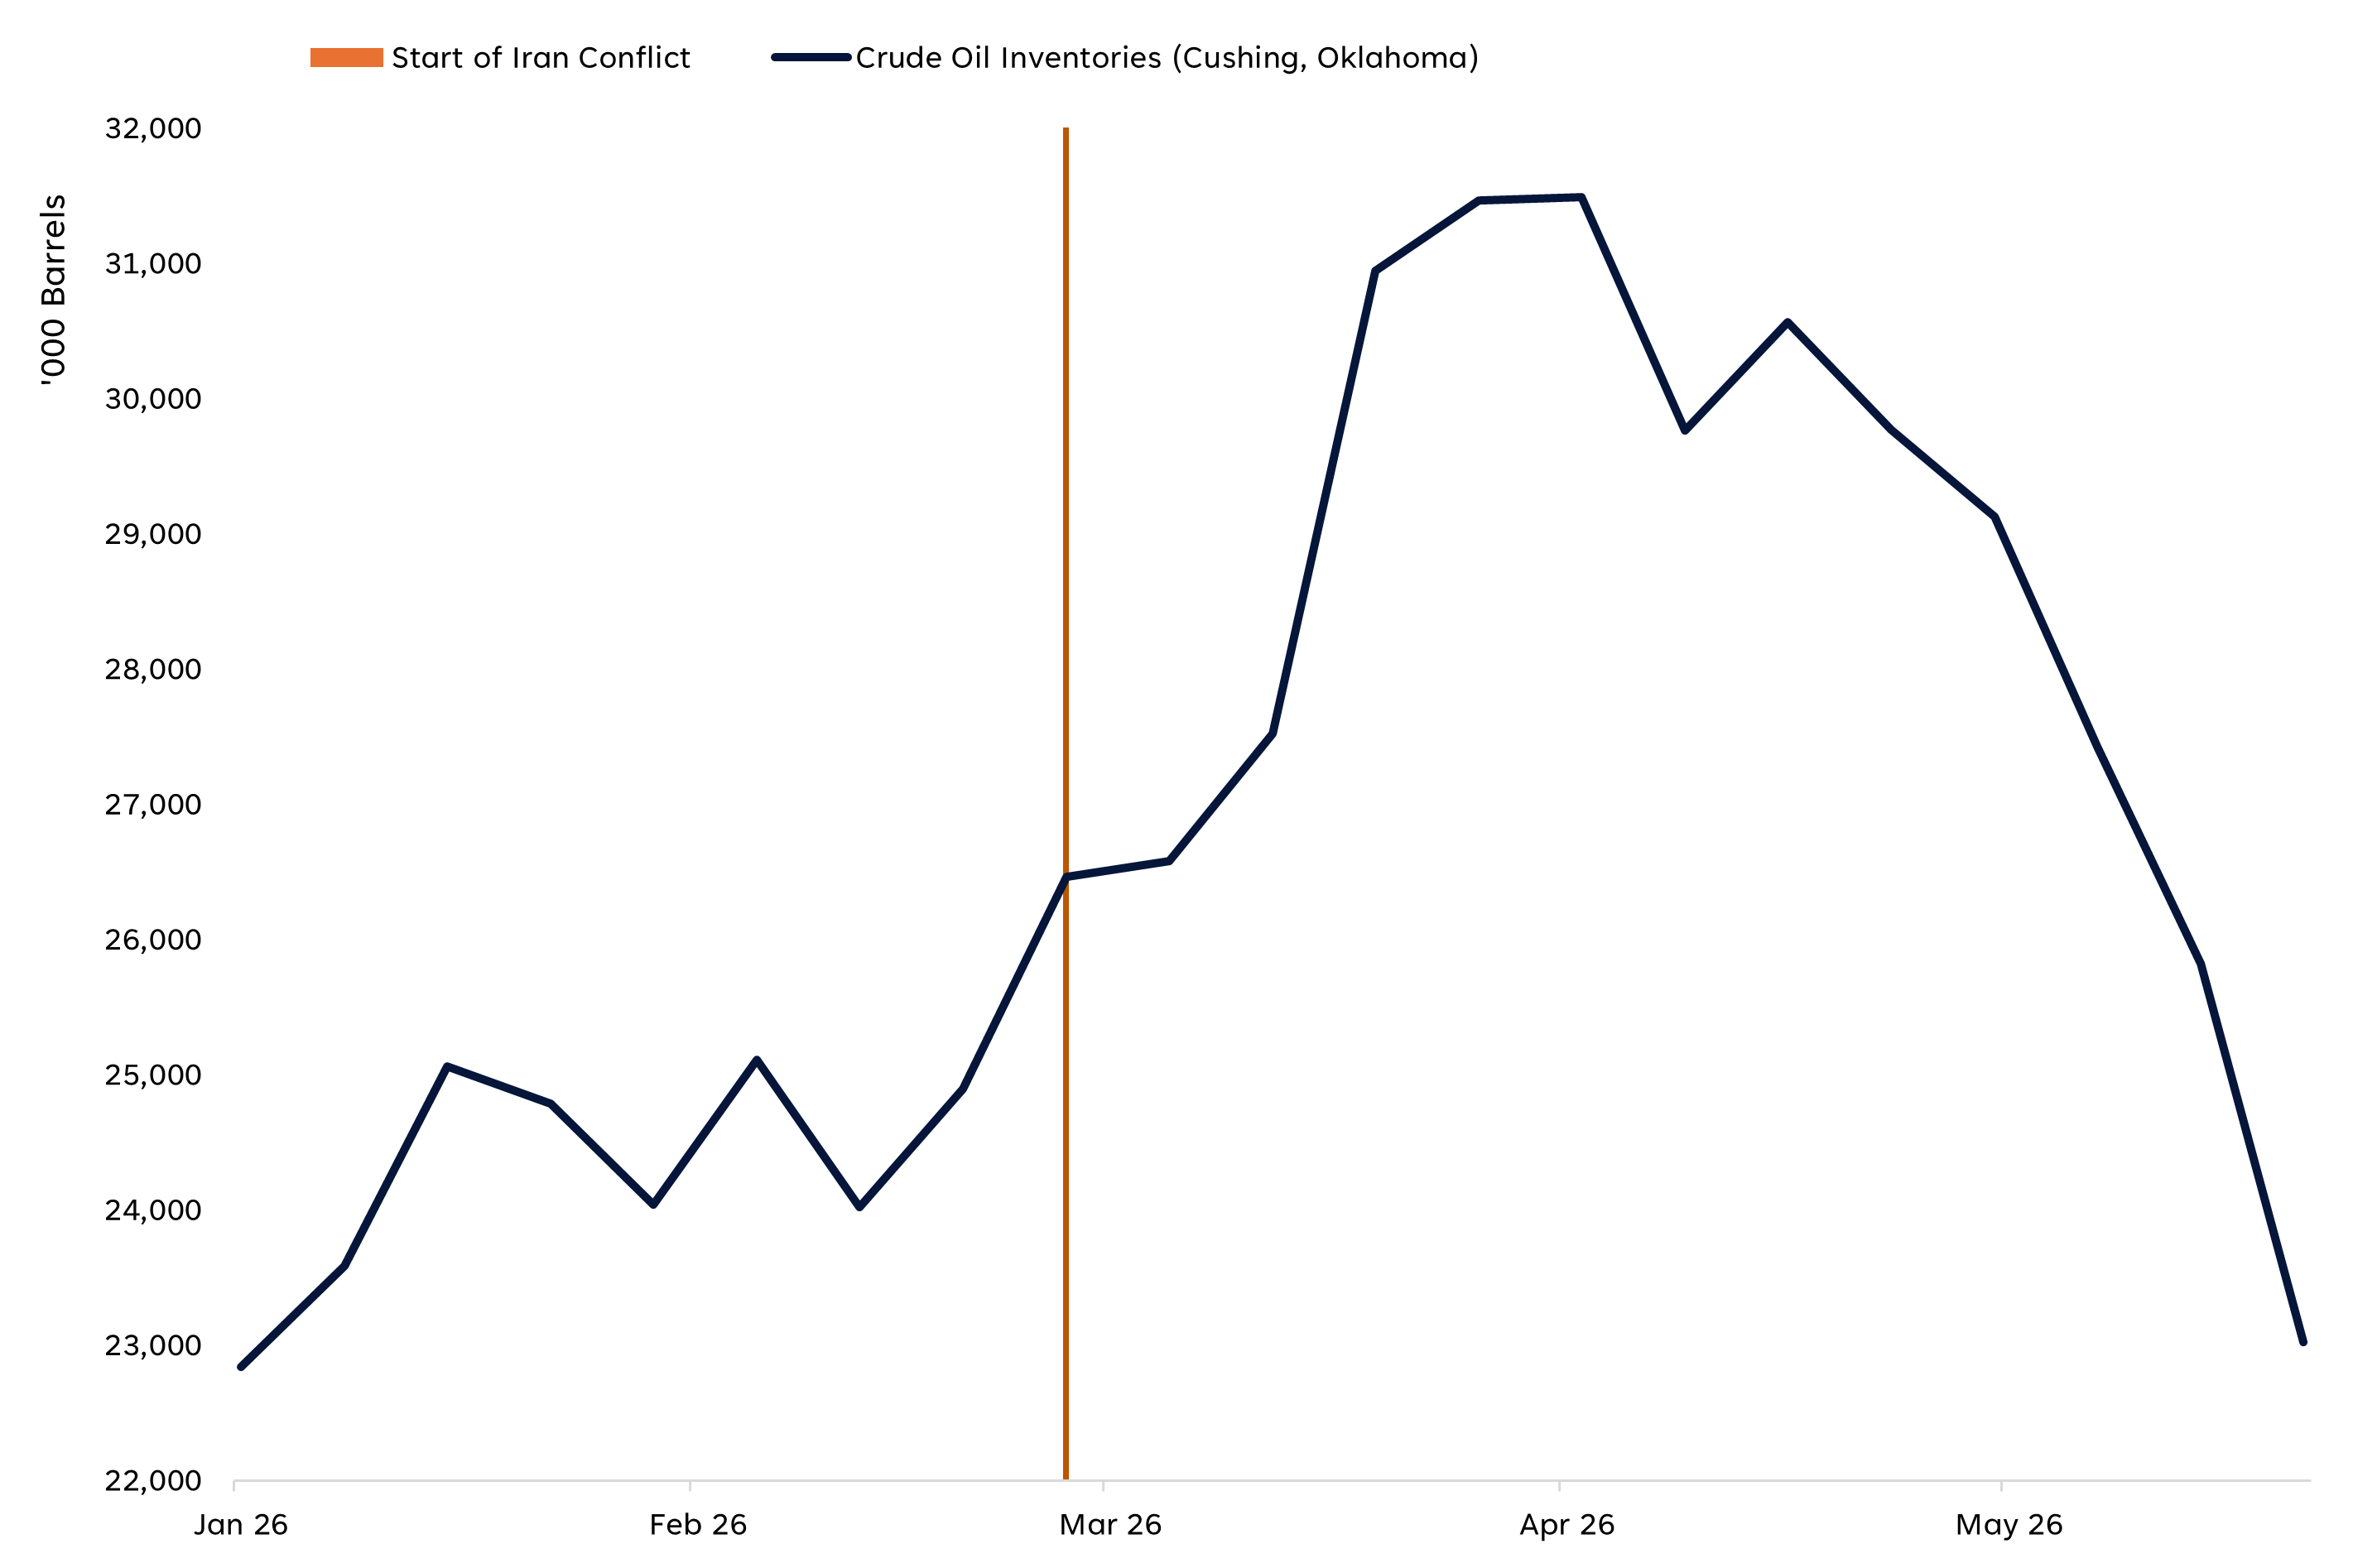
Source: LPL Research, U.S. Department of Energy, Bloomberg 06/03/26
Disclosure: Past performance is no guarantee of future results.
Meanwhile, the underlying physical backdrop remains tight. Inventories continue to draw at a steady clip and will only keep declining in the event of a prolonged negotiation period. Against that backdrop, the near-term risk profile for crude prices still appears skewed to the upside, in our view. For that outlook to shift in a meaningful way, we would need to see not only a near-term MOU but also clear and tangible progress toward a broader agreement that more permanently restores shipping flows closer to normal levels. At this stage, market participants appear to be getting somewhat ahead of themselves, with pricing reflecting a degree of conviction that may not yet be fully supported by actual developments.
Important Disclosures
This material is for general information only and is not intended to provide specific advice or recommendations for any individual. There is no assurance that the views or strategies discussed are suitable for all investors. To determine which investment(s) may be appropriate for you, please consult your financial professional prior to investing.
Investing involves risks including possible loss of principal. No investment strategy or risk management technique can guarantee return or eliminate risk.
Indexes are unmanaged and cannot be invested into directly. Index performance is not indicative of the performance of any investment and does not reflect fees, expenses, or sales charges. All performance referenced is historical and is no guarantee of future results.
This material was prepared by LPL Financial, LLC. All information is believed to be from reliable sources; however LPL Financial makes no representation as to its completeness or accuracy.
Unless otherwise stated LPL Financial and the third party persons and firms mentioned are not affiliates of each other and make no representation with respect to each other. Any company names noted herein are for educational purposes only and not an indication of trading intent or a solicitation of their products or services.
Asset Class Disclosures –
International investing involves special risks such as currency fluctuation and political instability and may not be suitable for all investors. These risks are often heightened for investments in emerging markets.
Bonds are subject to market and interest rate risk if sold prior to maturity.
Municipal bonds are subject and market and interest rate risk and potentially capital gains tax if sold prior to maturity. Interest income may be subject to the alternative minimum tax. Municipal bonds are federally tax-free but other state and local taxes may apply.
Preferred stock dividends are paid at the discretion of the issuing company. Preferred stocks are subject to interest rate and credit risk. They may be subject to a call features.
Alternative investments may not be suitable for all investors and involve special risks such as leveraging the investment, potential adverse market forces, regulatory changes and potentially illiquidity. The strategies employed in the management of alternative investments may accelerate the velocity of potential losses.
Mortgage backed securities are subject to credit, default, prepayment, extension, market and interest rate risk.
High yield/junk bonds (grade BB or below) are below investment grade securities, and are subject to higher interest rate, credit, and liquidity risks than those graded BBB and above. They generally should be part of a diversified portfolio for sophisticated investors.
Precious metal investing involves greater fluctuation and potential for losses.
The fast price swings of commodities will result in significant volatility in an investor’s holdings.
This research material has been prepared by LPL Financial LLC.
Not Insured by FDIC/NCUA or Any Other Government Agency | Not Bank/Credit Union Deposits or Obligations | Not Bank/Credit Union Guaranteed | May Lose Value
For Public Use – Tracking: #1119572
May Flows: Equities Dominate
Equity Record Highs Shape May Fund Flows
Jeff Buchbinder | Chief Equity Strategist
Last Updated: June 03, 2026
Additional content provided by Kent Cullinane, Sr. Analyst, Research.
With May behind us, we conducted a deep dive into exchange-traded fund (ETF) flows over the month and year-to-date (YTD) periods. Flows measure the net movement of cash into and out of investment vehicles, such as mutual funds and ETFs. We analyzed flows to gain insight on investor demand and sentiment surrounding asset classes, sectors, and other segments of markets.
Broad Asset Class Flows
Global markets in May continued a broad risk-on tone, with equities closing the month at record highs on resilient growth and strong artificial intelligence (AI)-driven earnings, despite ongoing geopolitical uncertainty and persistent inflation. Bond yields moved higher as oil prices remained at multi-year highs, leading investors to scale back expectations for rate cuts by year-end — even as a new Federal Reserve (Fed) Chair was sworn in late in the month. Outside of traditional assets, capital continued to flow into private markets and AI-linked infrastructure, while commodities and currencies remained closely tied to energy dynamics, reinforcing the increasingly interconnected nature of the macro landscape.
The ETF market climbed to a record $15.7 trillion in assets in May, with both strong inflows and market performance contributing to the milestone. Equity ETFs drove the bulk of demand with $134 billion of inflows, followed by fixed income at $62 billion, and alternatives at $4.3 billion. Currency ETFs were the only asset class to experience outflows, with a net outflow of $2.5 billion, driven largely by cryptocurrency — while not a traditional fiat currency — as higher interest rates and strong equity returns reduced the relative appeal of crypto assets.
For the year-to-date (YTD) period, ETFs gathered $832 billion in assets, with roughly two-thirds of that capital flowing into equity ETFs. Equities now represent nearly 80% of total ETF market share, up marginally from 79% at the end of April. The combination of stellar performance and risk-on investor sentiment contributed to the surge in asset growth. Bonds make up another 16% of the total ETF market share, with their relative share marginally decreasing. Combined, stock and bond ETFs represent more than 95% of the ETF industry. Outside of traditional asset classes, commodities represent roughly 2.3% of remaining ETF assets or $353 billion, followed by alternatives ($138 billion), currency ($119 billion), and asset allocation strategies ($45 billion). While commodities experienced net outflows during the month, all other segments saw net inflows, and every asset class has recorded positive net inflows year to date.
Trend Intact: Equities Continue to Dominate May Flows
Trailing one-month, YTD, and one-year net asset flows across broad asset classes (AUM, Billions $)
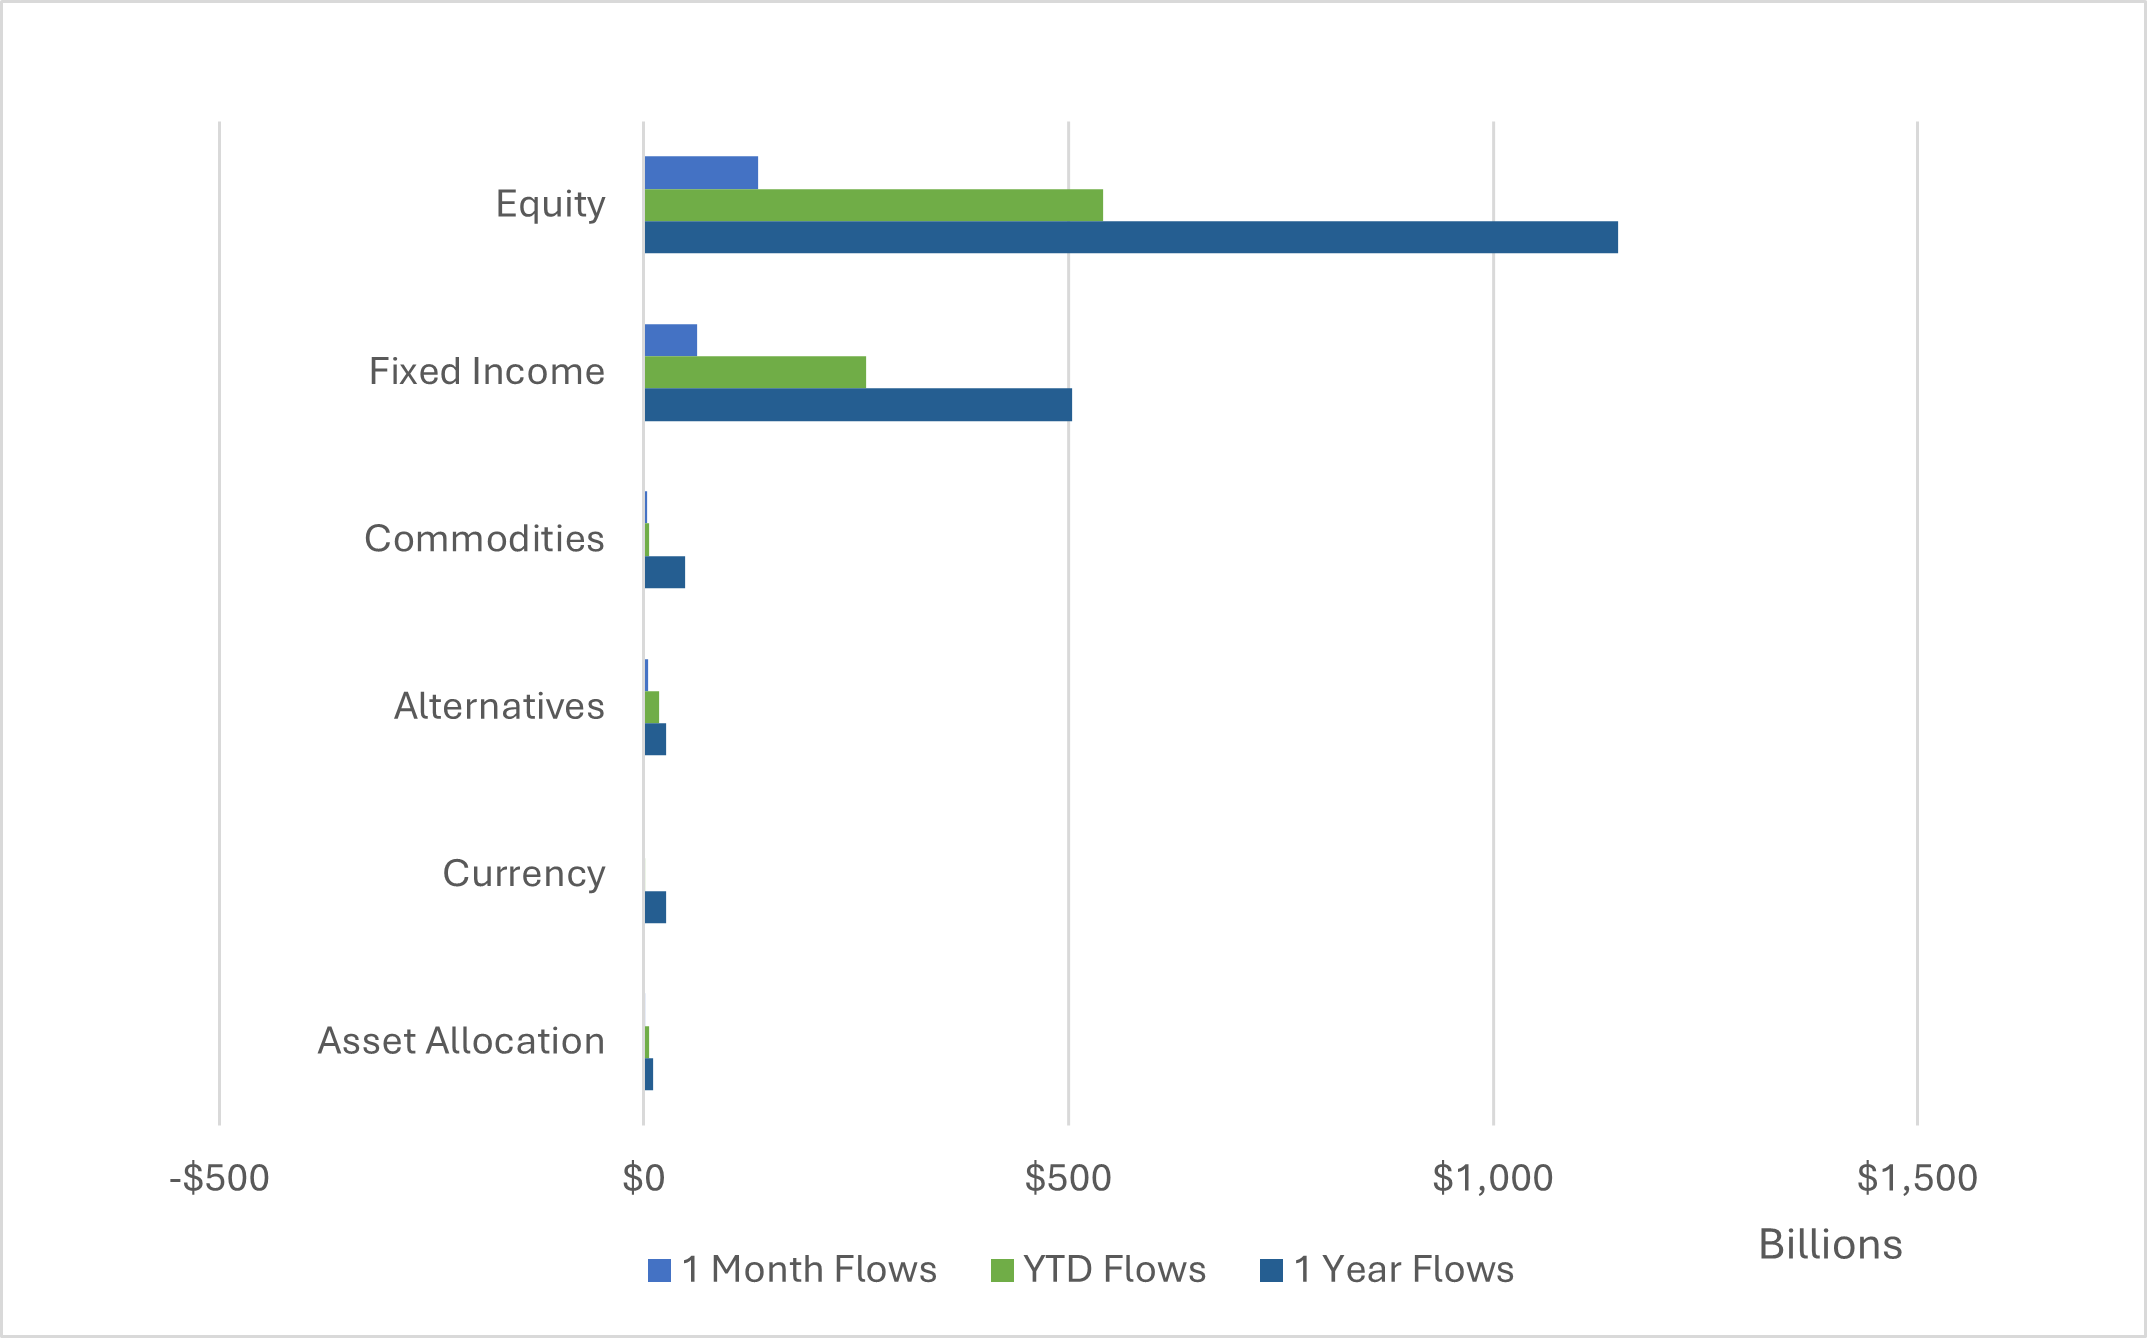
Source: LPL Research, FactSet 05/29/26
Disclosures: Past performance is no guarantee of future results.
Asset Class Specific Flows
Equities: Within equities, U.S. large caps continued to dominate by a wide margin, attracting $77 billion — more than half of all equity inflows and nearly ten times the next-largest category. Flows into ultra-short Treasury ETFs followed distantly at $7.5 billion. Investors remained heavily tilted toward U.S. equities, supported by their relative insulation from Middle East geopolitical tensions and sustained AI-driven growth tailwinds. Other domestic segments also saw modest demand, with large cap growth and total market ETFs gathering $4.6 billion and $4.5 billion, ranking sixth and seventh, respectively. Large caps continued to outpace small caps significantly, reflecting not only their larger market footprint but also stronger performance, as the Nasdaq Composite Index (+8.4%) and S&P 500 (+5.3%) outpaced the Russell 2000 (+4.4%).
Outside of U.S. equities, global ex-U.S. total market and global semiconductor segments ranked third and fourth, respectively, in May inflows across all asset classes. Emerging market equities, ranking fifth largest by flows YTD, have been the top regional performer (relative to domestic and developed ex-U.S. equities), rising 25.6%. The rally has been driven by a shift in leadership toward technology-heavy markets, such as Taiwan and South Korea, displacing prior leaders China and India. Taiwan leads global semiconductor manufacturing, while South Korea is a key supplier of memory chips essential for AI systems — positioning both as critical pillars of the AI supply chain and supporting infrastructure.
Despite South Korea benefitting tremendously from AI tailwinds, and its equity market more than doubling so far in 2026, South Korea equity ETFs were the top segment by outflows in May, shedding $2.8 billion. The country’s equity market is effectively a concentrated AI play, with the two largest components, Samsung and SK Hynix, comprising nearly half of the index. This level of concentration has left some investors increasingly cautious, raising concerns around concentration risk, valuation sensitivity, and the sustainability of returns tied so heavily to a single theme.
Fixed Income: In fixed income, ultra-short Treasury ETFs, highlighted earlier, ranked as the second-largest segment across asset classes by inflows, drawing $7.6 billion in May. Despite the broader risk-on backdrop, these traditionally defensive, cash-like instruments still attracted significant demand. The coexistence of strong inflows into both U.S. large caps (the top segment by inflows) and ultra-short Treasuries, alongside outflows from South Korean equities (the top segment by outflows), underscores a more nuanced market dynamic, as investors balanced participation in equity upside with liquidity needs and downside protection, while also rotating away from more concentrated or fully valued risk exposures. Following ultra-short Treasuries were investment-grade bonds and global bonds, ranking fifth and eighth, respectively.
While investor sentiment remained broadly positive, no fixed income segments appeared among the top 10 categories by outflows in May. Long-duration Treasury bonds were a notable laggard, declining over the month as expectations for persistently higher inflation and interest rates weighed on longer-term return prospects. In the YTD period, long-dated Treasuries ranked as the third largest segment by outflows ($5 billion), further highlighting the risk duration may play in portfolios at the prospect of higher rates.
Diversifying Strategies: Across diversifying strategies, gold ETFs saw a meaningful outflow in May at $1.5 billion, ranking sixth among asset classes. Gold’s relative appeal dissipated as geopolitical tensions continued to ease and equities moved higher. Gold and silver, two of the largest components of the commodities markets, rank in the top five in terms of outflows YTD as investors dump these traditionally defensive, safe-haven assets for global equities. Flows into oil and gas ETFs remained relatively muted despite prices holding at multi-year highs, suggesting investors viewed these elevated energy prices as potentially the peak.
While small in size (0.9%), alternatives broadly have seen positive flows, with traditional hedge fund strategies, such as global macro, event driven, and managed futures, which are now being offered in ETF vehicles (although with stringent restrictions to stay within regulatory compliance), continue to gain assets. Collectively, these alternative strategies can be seen as defensive positions that offer uncorrelated return streams to traditional equities and fixed income.
U.S Large Cap Catapults to Top Segment by 2026 Flows
Trailing YTD net asset flows across FactSet segments (AUM, $ Billions)
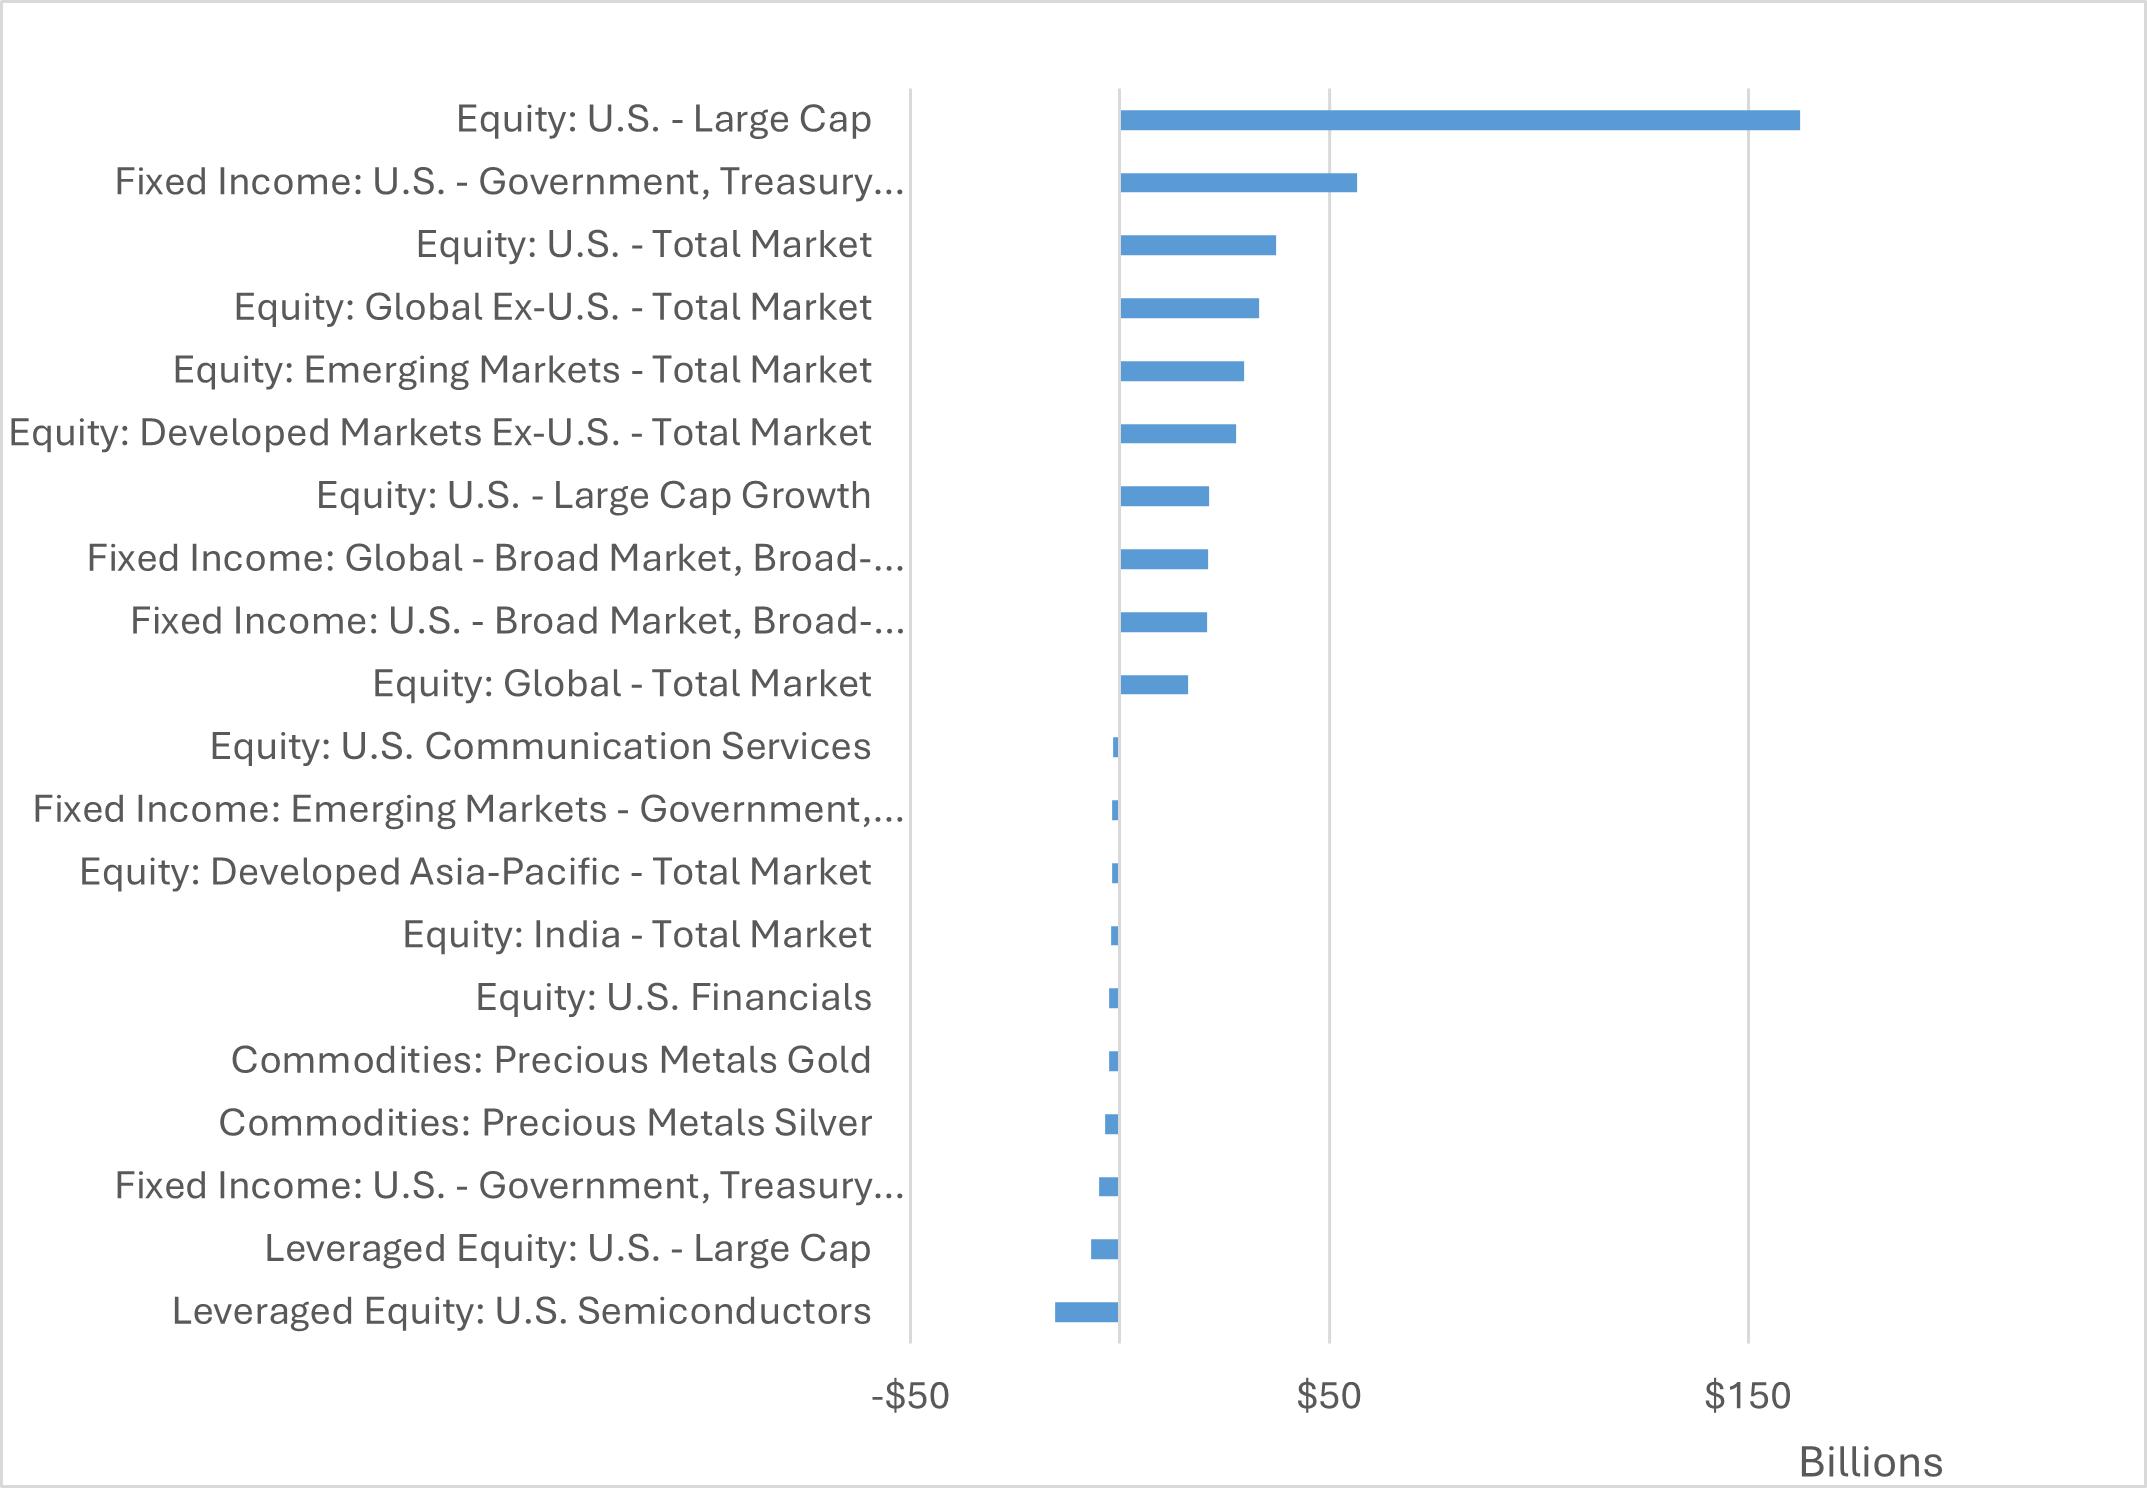
Source: LPL Research, FactSet 05/29/26
Disclosures: Past performance is no guarantee of future results.
Key Tactical Asset Allocation Takeaways
When comparing the latest LPL Research Strategic and Tactical Asset Allocation Committee (STAAC) views with the May flows data, there are a number of similarities. The STAAC continues to like the top asset class by assets and largest by YTD flows, U.S. large caps. The STAAC maintains a slight overweight to large/mid cap equities, with a modest tilt towards large/mid growth, which continues to benefit from sentiment surrounding AI and strong technology-driven earnings growth. Regionally, the STAAC had been warming up to the fifth-highest segment by flows YTD, emerging market equities, on improving fundamentals and technicals, but remains neutral from a geographic perspective within foreign equities given how much the asset class has run and maintains a slight bias towards the U.S.
Within fixed income, the STAAC prefers core bond sectors over spread sectors as historically tight spreads make the relative risk-return profile of spread sectors less attractive. Outside of traditional stocks and bonds, the STAAC maintains an allocation to alternative investments, specifically in global macro and multi-strategy funds.
Important Disclosures
This material is for general information only and is not intended to provide specific advice or recommendations for any individual. There is no assurance that the views or strategies discussed are suitable for all investors. To determine which investment(s) may be appropriate for you, please consult your financial professional prior to investing.
Investing involves risks including possible loss of principal. No investment strategy or risk management technique can guarantee return or eliminate risk.
Indexes are unmanaged and cannot be invested into directly. Index performance is not indicative of the performance of any investment and does not reflect fees, expenses, or sales charges. All performance referenced is historical and is no guarantee of future results.
This material was prepared by LPL Financial, LLC. All information is believed to be from reliable sources; however LPL Financial makes no representation as to its completeness or accuracy.
Unless otherwise stated LPL Financial and the third party persons and firms mentioned are not affiliates of each other and make no representation with respect to each other. Any company names noted herein are for educational purposes only and not an indication of trading intent or a solicitation of their products or services.
Asset Class Disclosures –
International investing involves special risks such as currency fluctuation and political instability and may not be suitable for all investors. These risks are often heightened for investments in emerging markets.
Bonds are subject to market and interest rate risk if sold prior to maturity.
Municipal bonds are subject and market and interest rate risk and potentially capital gains tax if sold prior to maturity. Interest income may be subject to the alternative minimum tax. Municipal bonds are federally tax-free but other state and local taxes may apply.
Preferred stock dividends are paid at the discretion of the issuing company. Preferred stocks are subject to interest rate and credit risk. They may be subject to a call features.
Alternative investments may not be suitable for all investors and involve special risks such as leveraging the investment, potential adverse market forces, regulatory changes and potentially illiquidity. The strategies employed in the management of alternative investments may accelerate the velocity of potential losses.
Mortgage backed securities are subject to credit, default, prepayment, extension, market and interest rate risk.
High yield/junk bonds (grade BB or below) are below investment grade securities, and are subject to higher interest rate, credit, and liquidity risks than those graded BBB and above. They generally should be part of a diversified portfolio for sophisticated investors.
Precious metal investing involves greater fluctuation and potential for losses.
The fast price swings of commodities will result in significant volatility in an investor’s holdings.
This research material has been prepared by LPL Financial LLC.
Not Insured by FDIC/NCUA or Any Other Government Agency | Not Bank/Credit Union Deposits or Obligations | Not Bank/Credit Union Guaranteed | May Lose Value
For Public Use – Tracking: #1116028
Key Takeaways from the SpaceX S-1
Counting Down to the SpaceX Launch
Thomas Shipp | Head of Equity Research
Last Updated: June 02, 2026
Additional content provided by Tucker Beale, Sr. Analyst, Research.
Interest in the IPO space has skyrocketed in the lead up to the public listing of SpaceX. And for good reason. SpaceX is looking to raise as much as $75 billion in what is expected to be the largest IPO ever, with a projected valuation range of $1.75 trillion to north of $2 trillion. Today we will cover what the company does, what it intends to do, and our key takeaways from the watershed S-1 filing.
SpaceX’s mission is to “build the systems and technologies necessary to make life multiplanetary, to understand the true nature of the universe, and to extend the light of consciousness to the stars.” Those lofty ambitions currently manifest as three businesses: Reusable rockets for space travel, Starlink for connectivity, and xAI’s Grok “truth seeking” frontier AI model (with access to the social media platform X for training data).
Along with serving their existing markets, these three business lines have the combined goal of starting to deploy orbital AI compute satellites working as data centers in space as early as 2028. By lowering the cost of transportation to orbit and leveraging expertise gained by managing the existing constellation of Starlink satellites, SpaceX looks to sidestep existing power bottlenecks restraining the AI race with a solar powered network of satellites. SpaceX management believes AI leadership will be defined by vertical integration of infrastructure and application. In other words, the ability to rapidly scale capacity to support exponential usage growth and frontier intelligence, supported by the belief that more computational resources lead to higher-quality intelligence. Management’s focus on this goal is outlined in their total addressable market (TAM) projections, which skew heavily towards AI enterprise applications powered by AI satellites and mirrors the estimated total market for knowledge work.
SpaceX’s Estimated TAM by Segment

Source: sec.gov 5/26/2026
Aiming to achieve something that has never been done on a scale never seen by leveraging technology that does not currently exist, comes with some risks. Known risks outlined by SpaceX include needing to increase launch cadence and payload capacity, which is dependent on the successful development of the newest “Starship” rocket at scale.
Other key risks include potential regulatory changes, customer concentration (~20% of 2025 revenue came from the U.S. government), integration of the newly acquired xAI business, costs associated with the development of AI capabilities, potential delays associated with development of new technologies, potential conflicts of interest between SpaceX and other entities owned by or affiliated with Elon Musk, and key person risk.
SpaceX is very much tied to the success of Elon Musk as he is the chief executive officer (CEO), chief technical officer (CTO), and chairman of the board. Musk has complete control of the company and per the S-1 filing, his “leadership, vision, and expertise are critical to the development of our technologies and the execution of our business strategy.” To incentivize execution on key initiatives, the company has granted the founder two batches of performance-based restricted shares so far in 2026. The performance milestones in the first batch of shares include the company achieving certain market capitalization levels and establishing a permanent human colony on Mars with at least one million inhabitants. The second batch has similar market cap milestones, but vest should the company create non-Earth-based data centers capable of delivering 100 terawatts of compute per year. Additionally, SpaceX does not maintain key-person life insurance on Elon Musk.
All of this adds up to a future-focused company with no shortage of opportunities and risks whose size, profitability, and ambitious timelines set it up for a potentially volatile introduction to public markets. We are intrigued by what SpaceX may accomplish in terms of extending humanity’s reach into the cosmos, but an ambitious mission on its own does not necessarily make for a sound company and there are a lot of hopes and dreams baked into the business plan. To SpaceX’s credit, many of these known risks are outlined nicely in the S-1 filing. The world needs ambitious companies pushing the boundaries of what is possible, but the ride between here and the stars may be too turbulent for some.
Disclosure: LPL Financial does not offer access to or purchase of Initial Public Offerings (IPOs)
Important Disclosures
This material is for general information only and is not intended to provide specific advice or recommendations for any individual. There is no assurance that the views or strategies discussed are suitable for all investors. To determine which investment(s) may be appropriate for you, please consult your financial professional prior to investing.
Investing involves risks including possible loss of principal. No investment strategy or risk management technique can guarantee return or eliminate risk.
Indexes are unmanaged and cannot be invested into directly. Index performance is not indicative of the performance of any investment and does not reflect fees, expenses, or sales charges. All performance referenced is historical and is no guarantee of future results.
This material was prepared by LPL Financial, LLC. All information is believed to be from reliable sources; however LPL Financial makes no representation as to its completeness or accuracy.
Unless otherwise stated LPL Financial and the third party persons and firms mentioned are not affiliates of each other and make no representation with respect to each other. Any company names noted herein are for educational purposes only and not an indication of trading intent or a solicitation of their products or services.
Asset Class Disclosures –
International investing involves special risks such as currency fluctuation and political instability and may not be suitable for all investors. These risks are often heightened for investments in emerging markets.
Bonds are subject to market and interest rate risk if sold prior to maturity.
Municipal bonds are subject and market and interest rate risk and potentially capital gains tax if sold prior to maturity. Interest income may be subject to the alternative minimum tax. Municipal bonds are federally tax-free but other state and local taxes may apply.
Preferred stock dividends are paid at the discretion of the issuing company. Preferred stocks are subject to interest rate and credit risk. They may be subject to a call features.
Alternative investments may not be suitable for all investors and involve special risks such as leveraging the investment, potential adverse market forces, regulatory changes and potentially illiquidity. The strategies employed in the management of alternative investments may accelerate the velocity of potential losses.
Mortgage backed securities are subject to credit, default, prepayment, extension, market and interest rate risk.
High yield/junk bonds (grade BB or below) are below investment grade securities, and are subject to higher interest rate, credit, and liquidity risks than those graded BBB and above. They generally should be part of a diversified portfolio for sophisticated investors.
Precious metal investing involves greater fluctuation and potential for losses.
The fast price swings of commodities will result in significant volatility in an investor’s holdings.
This research material has been prepared by LPL Financial LLC.
Not Insured by FDIC/NCUA or Any Other Government Agency | Not Bank/Credit Union Deposits or Obligations | Not Bank/Credit Union Guaranteed | May Lose Value
For Public Use – Tracking: #1114930