
Due Diligence
Weekly Market Performance | July 2, 2026
LPL Research
Last Updated: July 02, 2026
LPL Research provides its Weekly Market Performance for the week of June 29, 2026. As market watchers prepared for America’s 250th birthday celebration, global equity markets delivered a strong finish to the second quarter. The S&P 500 printed its best quarterly return since 2020 amid high profile economic data and rotation dynamics, while also posting a moderate gain over the holiday-shortened week. Asian equities capped their best quarterly result since 2009 while European shares also sealed their best quarter in six years. Fixed income markets traded lower over the last four days after ending a positive quarter. In commodities and currencies, oil continued to fall and the yen remained on intervention watch.
Stock Index Performance
| Index | Week-Ending | One Month | Year to Date |
| S&P 500 | 1.39% | -2.02% | 8.92% |
| Dow Jones Industrial | 1.44% | 2.56% | 9.48% |
| Nasdaq Composite | 1.54% | -5.19% | 10.53% |
| Russell 2000 | -0.93% | 1.71% | 20.16% |
| MSCI EAFE | 1.52% | -0.88% | 8.40% |
| MSCI EM | -2.75% | -7.71% | 19.43% |
S&P 500 Index Sectors
| Sector | Week-Ending | One Month | Year to Date |
| Materials | 0.16% | 0.79% | 12.75% |
| Utilities | -1.67% | 3.96% | 6.51% |
| Industrials | 0.83% | 5.21% | 17.90% |
| Consumer Staples | -0.18% | 3.37% | 8.61% |
| Real Estate | -1.89% | 2.63% | 10.82% |
| Health Care | 1.59% | 11.80% | 5.39% |
| Financials | 3.25% | 7.91% | 1.15% |
| Consumer Discretionary | 2.56% | -1.71% | -1.29% |
| Information Technology | 0.12% | -10.25% | 14.66% |
| Communication Services | 4.80% | -2.29% | 2.08% |
| Energy | -1.51% | -8.03% | 17.67% |
Fixed Income and Commodities
| Indexes and Commodities | Week-Ending | One Month | Year to Date |
| Bloomberg U.S. Aggregate | -0.55% | 0.09% | 0.43% |
| Bloomberg Credit | -0.51% | 0.02% | 0.67% |
| Bloomberg Munis | 0.06% | 0.56% | 2.21% |
| Bloomberg High Yield | 0.21% | 0.28% | 1.97% |
| Oil | -1.14% | -27.01% | 19.19% |
| Natural Gas | -1.15% | 0.85% | -13.35% |
| Gold | 0.66% | -8.31% | -4.71% |
| Silver | 2.36% | -19.38% | -15.51% |
Source: LPL Research, Bloomberg 7/2/26 @ 3:10 p.m. ET
Disclosures: Indexes are unmanaged and cannot be invested in directly.
U.S. and International Equities
U.S. Equities: Stocks celebrated the 250th anniversary of the Declaration of Independence with solid gains this week after capping a blockbuster second quarter. Major averages rallied into quarter-end as dip buying emerged after last week’s slide, fueling a bounce in Magnificent Seven names further aided by macro data that generally underscored the resilient economic narrative. The S&P 500 sealed a 15.2% quarterly gain (including dividends) to mark its best quarter since 2020, while also capping a 10.2% total return over the first half of 2026.
Sentiment turned cautious to start the second half as investors appeared to book gains in semiconductor shares after the space logged its best quarterly advance on record. Breadth remained positive under the surface, however, with software, select Magnificent Seven names, and other recent underperformers faring well amid a continuation of momentum unwinding and rotation dynamics. Most S&P 500 constituents continued to rise despite chipmakers dragging on major indexes Thursday as bad news appeared to be good news for Wall Steet after weaker-than-expected payrolls data threw cold water on near-term rate hike expectations.
International Equities: European stocks tracked a healthy weekly advance on the back of Thursday’s rally. The region capped its best quarter since 2020 on Tuesday with the STOXX 600 Index ending June at record highs. Stocks were supported by European Central Bank (ECB) President Lagarde remarking that Europe is becoming less vulnerable to economic shocks on the final session of the quarter and shook off some hawkish-tilted central banker remarks during the following session to bounce back strongly as bets of a U.S. rate hike faded. Germany’s DAX Index led the late week rally, further supported by government officials unveiling an $11.4 billion annual tax relief package and a range of measures aimed at supporting the labor market.
Asian equities were on pace for a mostly lower week through Thursday’s session. Most major markets pared week-to-date gains following Thursday’s drop, with South Korea wiping out early week AI spending plan-driven gains as the National Pension Service resumed rebalancing and chipmakers faced downside pressure. Taiwan was a relative outperformer, alongside Hong Kong, which received some support from oversold technical indicators. Nonetheless, at Tuesday’s quarter-end the Asia-Pacific region sealed its strongest quarter since 2009, highlighted by Korea’s best quarterly result since 1998 and the strongest on record for Japan’s Nikkei.
Fixed Income, Currency, and Commodity Markets
Fixed Income: Core bonds, as measured by the Bloomberg Aggregate Index (Agg), traded lower on the week, weighed down by a notable mid-week rise in Treasury yields. Tuesday’s selling was triggered by a stronger-than-expected JOLTs jobs report, accelerating through the afternoon on likely month-end related flows before paring losses slightly on Thursday. Treasuries traded mixed on Thursday as Fed rate hike expectations ebbed, bolstering shorter-dated securities after softer than expected June payrolls data arrived less than one day after Fed Chair Kevin Warsh stated that price pressures have eased.
Earlier in the week, the Treasury market posted a slight monthly gain for June with support stemming from falling crude oil prices, partially offset by last month’s decidedly hawkish Fed meeting and strong economic data. Bond market sentiment was also shaped by a strong month for equities and record corporate bond issuance. For the quarter, the Agg bounced off mid-May lows to add 0.7%, while corporate bonds outperformed with a 1.4% return while mortgage-backed securities lagged with just a 0.6% advance.
Commodities and Currencies: The broader commodity complex was little changed through Thursday afternoon. Energy commodities dropped over the last four days, although losses were relatively modest, including roughly 1% losses for crude oil and natural gas prices. Last week’s declines for West Texas Intermediate (WTI) crude oil spilled over into the new week, hovering near pre-war levels on continued hopes that the mild recovery in traffic through the Strait of Hormuz is a precursor to returning to pre-conflict trends. Among highlights in the Persian Gulf, the United Arab Emirates reportedly restored its exports to over 3.9 million barrels daily. Easing concerns of a return to kinetic conflict also pressured crude prices. In metals, gold traded modestly higher, supported by reduced rate hike expectations following soft payrolls data and Fed Chair Warsh’s remarks of easing price pressures. Meanwhile, the U.S. Dollar Index dropped Thursday after hovering near the flatline on the same dynamic, although the yen remained in the currency spotlight. Price action was jittery for the Japanese currency as traders closely watched for signs of intervention from Tokyo as stubborn weakness near 40-year lows persisted.
Economic Weekly Roundup
Highlights from Friday’s Payrolls Release:
- Friday’s Bureau of Labor Statistics report showed that an additional 2.5 million have dropped out of the labor force since last year.
- Payrolls grew by 57,000 in June, supported by gains in business services and health care. The Leisure and Hospitality sector lost jobs.
- Those not in the labor force rose by roughly 2.5 million to 105.8 million, most likely due to folks giving up looking for work.
- The unemployment rate ticked down to 4.2% as fewer people were looking for a job last month. In a strong economy, a low unemployment rate can coexist with healthy participation rates but that’s not the case now.
- Hours worked declined, indicating an upcoming slowdown in broader economic activity.
- Flows are revealing and provide another perspective on the labor market. We’ve seen a rising trend in people dropping out of the labor force (whether they were previously employed or unemployed). This suggests the job market is cooling down.
Bottom Line: Firms are still adding to their payrolls, but hours worked are below pre-pandemic levels as firms cut back labor utilization. A concerning trend is the increasing flow of individuals dropping out of the job market altogether. For now, the labor market is holding, giving the Fed opportunity to stay focused on price stability.
The Week Ahead
The following economic data is slated for the week ahead:
- Monday: S&P Global U.S. Services and Composite PMIs (Jun final), ISM Services Index (Jun)
- Tuesday: ADP Weekly Employment Change (Jun 20), Trade Balance (May)
- Wednesday: MBA Mortgage Applications (Jun 3), Wholesale Inventories (May final), FOMC Meeting Minutes (Jun 17), Consumer Credit (May)
- Thursday: Initial Jobless Claims (Jul 4), Continuing Claims (Jun 27), Existing Home Sales (Jun)
- Friday: No economic releases scheduled
Important Disclosures
This material is for general information only and is not intended to provide specific advice or recommendations for any individual. There is no assurance that the views or strategies discussed are suitable for all investors. To determine which investment(s) may be appropriate for you, please consult your financial professional prior to investing.
Investing involves risks including possible loss of principal. No investment strategy or risk management technique can guarantee return or eliminate risk.
Indexes are unmanaged and cannot be invested into directly. Index performance is not indicative of the performance of any investment and does not reflect fees, expenses, or sales charges. All performance referenced is historical and is no guarantee of future results.
This material was prepared by LPL Financial, LLC. All information is believed to be from reliable sources; however LPL Financial makes no representation as to its completeness or accuracy.
Unless otherwise stated LPL Financial and the third party persons and firms mentioned are not affiliates of each other and make no representation with respect to each other. Any company names noted herein are for educational purposes only and not an indication of trading intent or a solicitation of their products or services.
Asset Class Disclosures –
International investing involves special risks such as currency fluctuation and political instability and may not be suitable for all investors. These risks are often heightened for investments in emerging markets.
Bonds are subject to market and interest rate risk if sold prior to maturity.
Municipal bonds are subject and market and interest rate risk and potentially capital gains tax if sold prior to maturity. Interest income may be subject to the alternative minimum tax. Municipal bonds are federally tax-free but other state and local taxes may apply.
Preferred stock dividends are paid at the discretion of the issuing company. Preferred stocks are subject to interest rate and credit risk. They may be subject to a call features.
Alternative investments may not be suitable for all investors and involve special risks such as leveraging the investment, potential adverse market forces, regulatory changes and potentially illiquidity. The strategies employed in the management of alternative investments may accelerate the velocity of potential losses.
Mortgage backed securities are subject to credit, default, prepayment, extension, market and interest rate risk.
High yield/junk bonds (grade BB or below) are below investment grade securities, and are subject to higher interest rate, credit, and liquidity risks than those graded BBB and above. They generally should be part of a diversified portfolio for sophisticated investors.
Precious metal investing involves greater fluctuation and potential for losses.
The fast price swings of commodities will result in significant volatility in an investor’s holdings.
This research material has been prepared by LPL Financial LLC.
Not Insured by FDIC/NCUA or Any Other Government Agency | Not Bank/Credit Union Deposits or Obligations | Not Bank/Credit Union Guaranteed | May Lose Value
For Public Use – Tracking: #1135002
What’s Next for a Coiled-Up Dollar?
A Coiled Spring: The Dollar’s Next Move
Kristian Kerr | Head of Macro Strategy
Last Updated: July 01, 2026
The dollar holds a central place in global markets due to its role as the world’s reserve currency. Its movements influence cross-asset correlations, shape liquidity conditions, and often offer early indications of shifts in the broader macro regime. In short, it is a critical variable that warrants close attention.
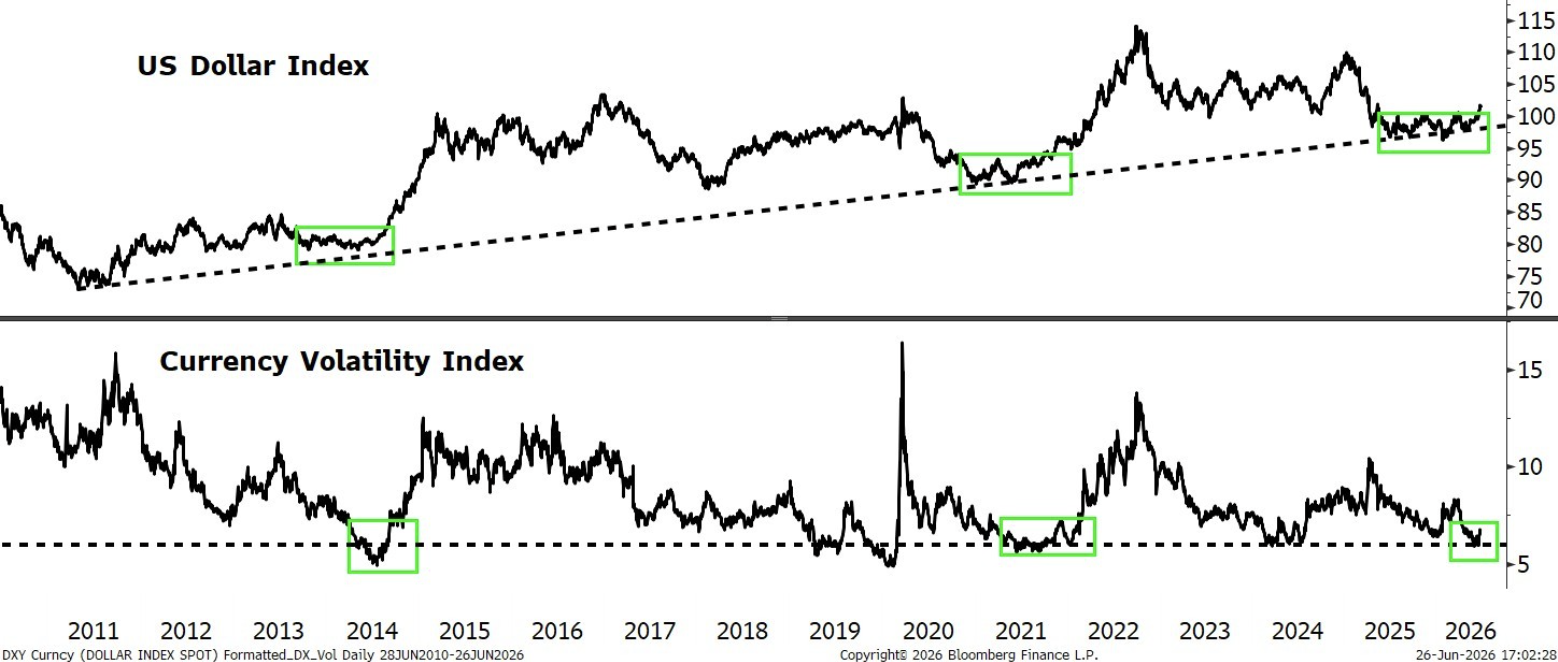
Over the past 11 months, the U.S. Dollar Index (DXY) has traded within a relatively tight five percent range, a notable period of consolidation. More importantly, there are now early signs of a breakout, with price action beginning to push higher and move beyond the confines of the recent range. Equally significant is that throughout the recent period of consolidation, the dollar repeatedly threatened to break the secular uptrend that has been in place since 2011, and despite numerous attempts to move lower, the dollar never really cracked.
From a technical standpoint, this current setup is constructive. Breakouts from extended consolidations often see meaningful follow through, particularly when they emerge from a backdrop of compressed volatility. And as highlighted in the Dollar Index chart, foreign exchange (FX) volatility has been notably subdued recently with several measures of currency volatility reaching near four-year lows. Given the mean reverting nature of volatility, that kind of compression often behaves like a coiled spring, and when it releases, the resulting moves are often both sharp and persistent.
Dollar Index Showing Signs of a Breakout, But FX Volatility Remains a Wildcard
Source: LPL Research, Bloomberg 06/26/26
Disclosure: All indexes are unmanaged and cannot be invested in directly. Past performance is no guarantee of future results.
In terms of levels, a sustained move through 103 on the DXY would go a long way toward confirming that a more durable bottom is in place. That would shift the balance of risks higher, and potentially even signal the resumption of the secular dollar uptrend. But a move like that would not occur in isolation. It would carry important cross asset implications. For instance, historical periods of dollar strength have been associated with relative outperformance of U.S. equities versus the rest of the world.
On the fundamental side, the recent firming in the dollar has not occurred without support. The U.S. continues to maintain a meaningful rate advantage relative to other G10 economies. At the same time, the Federal Reserve (Fed) has leaned more hawkish at the margin, while incoming U.S. economic data has continued to show signs of improvement. The combination of relative policy stance and a resilient growth backdrop have helped underpin the recent move higher in the dollar. That said, the policy side is not without risk. While markets continue to price the potential for further Fed tightening, actually delivering additional hikes may prove to be a high bar. The gap between market expectations and realized policy will be something to watch closely. In our view, the key risk to this developing uptrend in the dollar would be a shift in tone from the Fed back toward a more definitive neutral posture, as any softening in policy expectations would likely take some of the support out from under the currency.
On the downside, there are a couple of key levels to note. A move back below the 200-day moving average, which sits near 99.00, would raise concerns that the recent strength is just another false start of many over the past year. A deeper decline through 95.50 would reopen the case for a broader secular shift lower. For now, the weight of the evidence suggests the path of least resistance for the dollar is higher. If that view is correct, the implications will extend well beyond FX and into the broader macro landscape.
Important Disclosures
This material is for general information only and is not intended to provide specific advice or recommendations for any individual. There is no assurance that the views or strategies discussed are suitable for all investors. To determine which investment(s) may be appropriate for you, please consult your financial professional prior to investing.
Investing involves risks including possible loss of principal. No investment strategy or risk management technique can guarantee return or eliminate risk.
Indexes are unmanaged and cannot be invested into directly. Index performance is not indicative of the performance of any investment and does not reflect fees, expenses, or sales charges. All performance referenced is historical and is no guarantee of future results.
This material was prepared by LPL Financial, LLC. All information is believed to be from reliable sources; however LPL Financial makes no representation as to its completeness or accuracy.
Unless otherwise stated LPL Financial and the third party persons and firms mentioned are not affiliates of each other and make no representation with respect to each other. Any company names noted herein are for educational purposes only and not an indication of trading intent or a solicitation of their products or services.
Asset Class Disclosures –
International investing involves special risks such as currency fluctuation and political instability and may not be suitable for all investors. These risks are often heightened for investments in emerging markets.
Bonds are subject to market and interest rate risk if sold prior to maturity.
Municipal bonds are subject and market and interest rate risk and potentially capital gains tax if sold prior to maturity. Interest income may be subject to the alternative minimum tax. Municipal bonds are federally tax-free but other state and local taxes may apply.
Preferred stock dividends are paid at the discretion of the issuing company. Preferred stocks are subject to interest rate and credit risk. They may be subject to a call features.
Alternative investments may not be suitable for all investors and involve special risks such as leveraging the investment, potential adverse market forces, regulatory changes and potentially illiquidity. The strategies employed in the management of alternative investments may accelerate the velocity of potential losses.
Mortgage backed securities are subject to credit, default, prepayment, extension, market and interest rate risk.
High yield/junk bonds (grade BB or below) are below investment grade securities, and are subject to higher interest rate, credit, and liquidity risks than those graded BBB and above. They generally should be part of a diversified portfolio for sophisticated investors.
Precious metal investing involves greater fluctuation and potential for losses.
The fast price swings of commodities will result in significant volatility in an investor’s holdings.
This research material has been prepared by LPL Financial LLC.
Not Insured by FDIC/NCUA or Any Other Government Agency | Not Bank/Credit Union Deposits or Obligations | Not Bank/Credit Union Guaranteed | May Lose Value
For Public Use – Tracking: #1133108
Second Quarter Earnings Preview Including Key Factors to Monitor
What to Watch This Earnings Season
Jeff Buchbinder | Chief Equity Strategist
Last Updated: June 30, 2026
The second quarter wraps up today, and it was a good one. With the S&P 500 having returned more than 14% (including dividends) with just one trading day left, it will almost certainly end up being the best quarter for the index since the second quarter of 2020. Technology was the leader despite the June weakness.
As the quarter ends, corporate America closes its books and prepares to report results to the public over the coming months. First quarter results were spectacular, as S&P 500 companies collectively grew earnings per share (EPS) by 29%. Even excluding private equity gains on OpenAI and Anthropic shares held by mega-cap technology companies, we estimate last quarter’s earnings were up over 20%. Will companies deliver another blockbuster?
If earnings growth is going to again approach 30% — very possible with consensus estimates calling for 23% — the technology sector will have to do more heavy lifting. Memory chip maker Micron (MU) did its part by growing earnings 12x and contributing to 4.5 points of S&P 500 EPS growth by itself. In fact, MU and NVIDIA (NVDA) are expected to drive 40% of overall S&P 500 EPS growth and, according to Goldman Sachs estimates, artificial intelligence (AI) infrastructure stocks are expected to contribute 60% of S&P 500 EPS (the technology sector is expected to contribute a similar amount). Besides technology, only energy, at 5.0%, is expected to contribute more than one point of S&P 500 EPS growth.
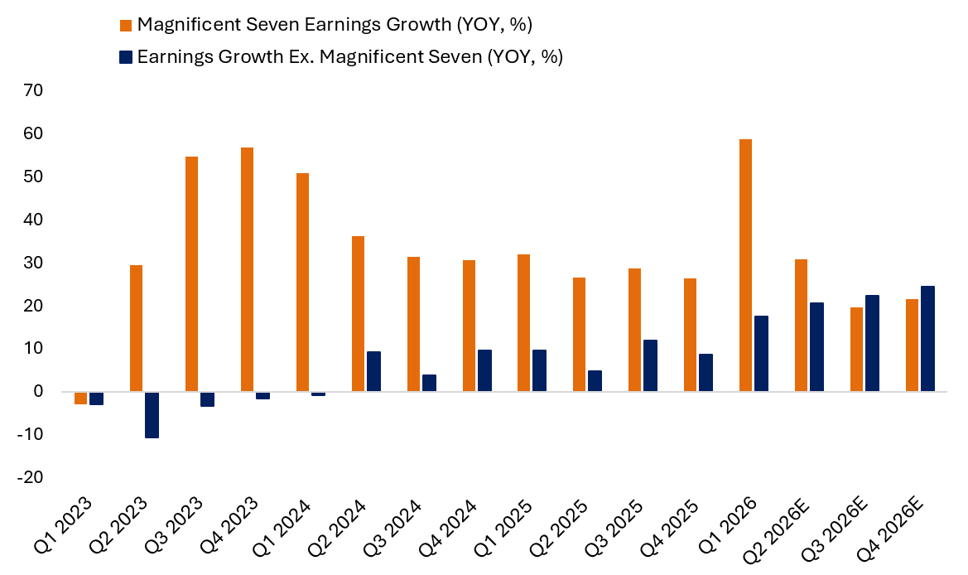
That strength from tech may not be surprising if you’ve been following earnings in recent quarters. What might surprise you, though, is that S&P 500 EPS growth excluding the Magnificent Seven — bolstered by the memory makers — was 17.5% in the first quarter and is expected to eclipse 20.5% in the second quarter (Q2).
S&P 500 Earnings Growth Excluding the Magnificent Seven May Exceed 20% in Q2
Source: LPL Research, Bloomberg 06/29/26
Disclosures: Indexes are unmanaged and cannot be invested in directly. Past performance is no guarantee of future results. Estimates may not materialize as predicted and are subject to change.
Ramp-up of Profit Margins is Equally Impressive
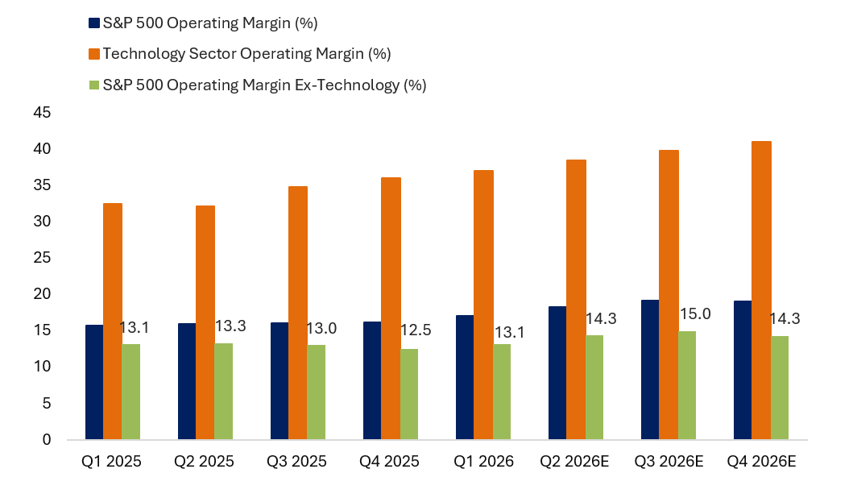
If earnings are going to hit consensus estimates in Q2 and the second half, margins will have to expand quite a bit — enough to convert low-teens revenue growth into at least double that pace of earnings growth. As shown in the “Profit Margin Expansion is Not Just a Technology Story” chart, margins excluding technology are on the way up. The productivity from AI should increasingly show up in the form of higher profit margins in the second half of 2026. Lower tariffs will also be helpful, although higher memory chip prices and energy and other bottlenecks in the Strait of Hormuz could erode company margins, particularly in the technology sector.
Profit Margin Expansion is Not Just a Technology Story
Source: LPL Research, Bloomberg 06/29/26
Disclosures: Indexes are unmanaged and cannot be invested in directly. Past performance is no guarantee of future results. Estimates may not materialize as predicted and are subject to change.
Conclusion
The AI boom should drive another quarter of S&P 500 EPS growth near 30% when all results are in. The boost to oil prices from the Iran conflict will enable energy to chip in, but technology is expected to do most of the work. Like last quarter, investors will want to see returns on the massive AI investment. Margins will be closely watched, as they face several crosscurrents and are key to potentially keeping up this torrid pace of earnings growth as corporate America seeks out AI productivity gains.
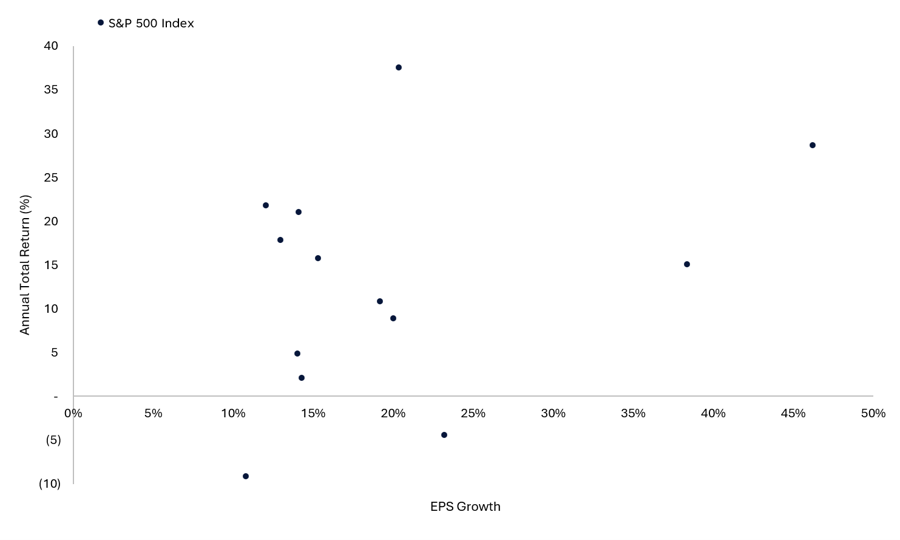
History is clear on the rewards for strong earnings, because when S&P 500 earnings grow double-digits, the average annual S&P 500 index return is 14.3% with gains in 10 of the past 12 years. This year should make it 11 out of 13. The bursting of the dot-com bubble in 2000 and the Fed rate hike scare of 2018 were the only two years since 1990 when the S&P 500 was down despite double-digit earnings growth.. Although it is important to remember that past performance does not guarantee future results.
Double-Digit Earnings Growth Years Tend to Be Strong Ones for Stocks
Source: LPL Research, Bloomberg 06/29/26
Disclosures: Indexes are unmanaged and cannot be invested in directly. Past performance is no guarantee of future results.2003 was omitted as an outlier with annual EPS growth of 362.3% and an annual total return of 28.7%. Current year is shown on table based on year-to-date performance and earnings estimates.
Important Disclosures
This material is for general information only and is not intended to provide specific advice or recommendations for any individual. There is no assurance that the views or strategies discussed are suitable for all investors. To determine which investment(s) may be appropriate for you, please consult your financial professional prior to investing.
Investing involves risks including possible loss of principal. No investment strategy or risk management technique can guarantee return or eliminate risk.
Indexes are unmanaged and cannot be invested into directly. Index performance is not indicative of the performance of any investment and does not reflect fees, expenses, or sales charges. All performance referenced is historical and is no guarantee of future results.
This material was prepared by LPL Financial, LLC. All information is believed to be from reliable sources; however LPL Financial makes no representation as to its completeness or accuracy.
Unless otherwise stated LPL Financial and the third party persons and firms mentioned are not affiliates of each other and make no representation with respect to each other. Any company names noted herein are for educational purposes only and not an indication of trading intent or a solicitation of their products or services.
Asset Class Disclosures –
International investing involves special risks such as currency fluctuation and political instability and may not be suitable for all investors. These risks are often heightened for investments in emerging markets.
Bonds are subject to market and interest rate risk if sold prior to maturity.
Municipal bonds are subject and market and interest rate risk and potentially capital gains tax if sold prior to maturity. Interest income may be subject to the alternative minimum tax. Municipal bonds are federally tax-free but other state and local taxes may apply.
Preferred stock dividends are paid at the discretion of the issuing company. Preferred stocks are subject to interest rate and credit risk. They may be subject to a call features.
Alternative investments may not be suitable for all investors and involve special risks such as leveraging the investment, potential adverse market forces, regulatory changes and potentially illiquidity. The strategies employed in the management of alternative investments may accelerate the velocity of potential losses.
Mortgage backed securities are subject to credit, default, prepayment, extension, market and interest rate risk.
High yield/junk bonds (grade BB or below) are below investment grade securities, and are subject to higher interest rate, credit, and liquidity risks than those graded BBB and above. They generally should be part of a diversified portfolio for sophisticated investors.
Precious metal investing involves greater fluctuation and potential for losses.
The fast price swings of commodities will result in significant volatility in an investor’s holdings.
This research material has been prepared by LPL Financial LLC.
Not Insured by FDIC/NCUA or Any Other Government Agency | Not Bank/Credit Union Deposits or Obligations | Not Bank/Credit Union Guaranteed | May Lose Value
For Public Use – Tracking: #1132969
Weekly Market Performance | June 26, 2026
LPL Research
Last Updated: June 26, 2026
LPL Research provides its Weekly Market Performance for the week of June 22, 2026. The last full week of the first half was marked by a push-and-pull between AI-driven optimism and concerns of stretched positioning, leaving global equities broadly lower. In the U.S., simultaneous quarter-end rebalancing and mixed mega-cap news also weighed on sentiment, though broader market strength helped put a floor under index-level losses. Internationally, European and Asian stocks also fell amid the risk-off tone. Fixed income markets rallied as cooling inflation pressures and shifting Fed expectations supported bonds, while commodities declined — led by a sharp drop in oil prices — and the U.S. dollar built on recent strength despite easing rate hike expectations.
Stock Index Performance
| Index | Week-Ending | One Month | Year to Date |
| S&P 500 | -2.01% | -2.25% | 7.36% |
| Dow Jones Industrial | 0.57% | 2.77% | 7.90% |
| Nasdaq Composite | -4.64% | -5.14% | 8.80% |
| Russell 2000 | 0.39% | 2.43% | 20.53% |
| MSCI EAFE | -1.85% | -2.52% | 6.72% |
| MSCI EM | -5.04% | -1.73% | 22.87% |
S&P 500 Index Sectors
| Sector | Week-Ending | One Month | Year to Date |
| Materials | -0.35% | 0.82% | 12.31% |
| Utilities | 3.53% | 1.96% | 7.92% |
| Industrials | 0.64% | 4.34% | 17.09% |
| Consumer Staples | 1.58% | 0.62% | 8.87% |
| Real Estate | 3.74% | 1.22% | 12.72% |
| Health Care | 7.21% | 7.80% | 3.09% |
| Financials | 0.42% | 3.62% | -2.09% |
| Consumer Discretionary | -3.52% | -6.85% | -4.56% |
| Information Technology | -5.33% | -4.61% | 14.60% |
| Communication Services | -5.32% | -10.57% | -1.65% |
| Energy | 0.47% | -6.78% | 19.17% |
Fixed Income and Commodities
| Indexes and Commodities | Week-Ending | One Month | Year to Date |
| Bloomberg U.S. Aggregate | 0.40% | 0.88% | 0.89% |
| Bloomberg Credit | 0.34% | 0.91% | 1.12% |
| Bloomberg Munis | 0.08% | 1.24% | 2.08% |
| Bloomberg High Yield | -0.01% | 0.38% | 1.80% |
| Oil | -9.79% | -26.40% | 20.34% |
| Natural Gas | 0.00% | 11.64% | -12.34% |
| Gold | -2.16% | -9.80% | -5.87% |
| Silver | -9.28% | -23.44% | -17.84% |
Source: LPL Research, Bloomberg 6/26/26 @ 3:25 p.m. ET
Disclosures: Indexes are unmanaged and cannot be invested in directly.
U.S. and International Equities
U.S. Equities: Major equity averages ended a choppy week of trading lower after investors grappled between renewed optimism around the artificial intelligence (AI) trade and viewing the outsized rally as due for a breather. The Dow bucked the trend with a modest advance. The S&P 500 fell, struggling to hold on to early session gains in nearly every session as mechanical drivers around still-stretched positioning, and quarter-end rebalancing dynamics fueled a rotation toward defensive corners of the market. A fairly steady stream of corporate headlines from mega-cap names also acted as a headwind at the index level, offsetting broadly positive breadth and a slide in oil prices. Among highlights, Amazon (AMZN) and Microsoft (MSFT) were seen as potential targets for European Union legislation, Alphabet (GOOG/L) shares were pressured by the departure of multiple AI researchers to competitors, and Apple (AAPL) announced price hikes driven by elevated costs for memory chips. Further, Korean chipmaker SK Hynix announced reduced AI memory chip production and reports that the OpenAI initial public offering may be delayed, also took the wind out of big tech names sails. However, Wall Street ended a jittery week by trimming losses as healthy broad market gains offset continued weakness in chipmakers and lifted the equal weight S&P 500 to all-time highs.
International Equities: European benchmarks ended moderately lower, with more measured declines relative to the rest of the world as a smaller comparative tech exposure aided outperformance. Nonetheless, the risk-off tone still broadly dented stocks and lagging industrials and banking names dragged the STOXX 600 lower. The biggest development of the last five days was Prime Minister Starmer announcing his resignation on Monday, which briefly dented equities before swiftly bouncing on signs of an orderly transition on Downing Street.
Major Asian exchanges also declined with tech doubts driving up-and-down trading and heavily weighing on sentiment. Mainland China fared the best for the region amid relative tailwinds including fresh plans from Beijing to boost fiscal support for AI consumption and gains in Taiwan Semiconductor’s (TSM) competitors after the chipmaking giant announced price hikes. Hong Kong hovered near a technical bear market as investors continued to rotate toward mainland names and digested weak consumer data. South Korea faced sharp whipsaws which led to multiple trading halts as concerns of an overly stretched rally overshadowed SK Hynix’s plans for a U.S. listing. Japan was also dragged lower by tech shares despite some rise in oil flows in the Mideast.
Fixed Income, Currency, and Commodity Markets
Fixed Income: Core bonds, as measured by the Bloomberg Aggregate Index, traded higher this week as shorter-maturity Treasuries led a rise across the curve. Shifting expectations around the Federal Reserve’s (Fed) interest rate path were tabbed for the move as oil prices dropped toward pre-Iran conflict levels, ebbing traders’ inflation jitters. Upward pressure on yields received further reprieve after the Fed’s preferred inflation metric — the Personal Consumption Expenditures (PCE) price index — rose slightly less than markets expected last month while first quarter economic growth was unexpectedly revised higher, underscoring the resilient growth narrative. Simultaneously, under the surface, some likely support from quarterly rebalancing away from stocks, and a slight haven bid due to the risk-off tone also acted as a tailwind for bonds.
Commodities and Currencies: The broader commodity complex traded lower as oil and precious metals prices dropped. West Texas Intermediate (WTI) crude prices sank over 9% over the last five days, falling near pre-war levels and probing 17-week lows on Friday, as tanker traffic through the Strait of Hormuz showed some signs of life. While flows out of the Persian Gulf are still far below typical levels, market focus landed on increasing supply and hopes that the worst of supply disruptions may be in the rearview mirror. In precious metals, gold and silver both posted weekly losses. The latter faced stronger selling, extending its recent underperformance of gold, as silver also serves as an industrial metal which increases its sensitivity to shifts in investor risk appetite. Gold traded lower for a fourth straight week as the Fed’s hawkish-leaning tone continued to support the U.S. dollar, despite some easing in rate hike expectations. The greenback held on to week-to-date strength after paring gains from a 13-month high on cooler-than-expected May PCE, and remained on track for its strongest month since March.
Economic Weekly Roundup
Highlights from This Week’s Key Economic Releases:
- Shipments of nondefense capital goods excluding aircraft continue to surprise to the upside.
- Second quarter economic growth will be supported by strong business capital spending since we’ve seen a rise in shipments of capital goods for both April and May.
- The labor market is holding steady as weekly initial unemployment claims numbers are still below 225k. Those continuing to claim unemployment benefits remain historically low.
- On the inflation front, core Personal Consumption Expenditures (PCE) rose 0.3%, in line with consensus but pushed the annual pace up to 3.4% from 3.3% and is putting pressure on the consumer. One item to flag is air transportation since this sector is feeling the burden from the energy crisis.
- The savings rate was unchanged at 3% and is still very low as consumers are tapping into savings to support discretionary spending.
- One encouraging signal is the 0.4% month/month increase in compensation to keep up with inflation.
Bottom Line: If the labor market holds, we expect consumers will have the ability to maintain spending patterns. The real story is the amount of business investment, as measured by shipments of capital goods during May and April. Given the growth trajectory, the Fed is rightly focused on price stability and will remain hawkish this summer. If the Iran crisis creeps into Labor Day timeframe, we have a much higher chance that inflation pressures will seep into other categories and will force the Fed’s hand.
The Week Ahead
The following economic data is slated for the week ahead:
- Monday: Dallas Fed Manufacturing Activity
- Tuesday: FHFA House Price Index (Apr), S&P Case-Shiller 20-City and National Home Price Indexes (Apr), MNI Chicago PMI (Jun), Conference Board Consumer Confidence report (Jun), JOLTS Job Report (May), Dallas Fed Services Activity (Jun)
- Wednesday: Challenger Job Cuts (Jun), MBA Mortgage Applications (Jun 26), ADP Employment Change (Jun), S&P Global U.S. Manufacturing PMI (Jun final), ISM Manufacturing (Jun), Construction Spending (May), Omdia Total Vehicle Sales (Jun)
- Thursday: Change in Nonfarm, Private, and Manufacturing Payrolls (Jun), Average Hourly Earnings (Jun), Average Weekly Hours All Employees (Jun), Unemployment Rate (Jun), Labor Force Participation Rate (Jun), Underemployment Rate (Jun), Initial Jobless Claims (Jun 27), Continuing Claims (Jun 20), Factory Orders (May), Durable Goods Orders (May final), Capital Goods Orders and Shipments (May final)
- Friday: Independence Day holiday, no economic releases scheduled
Important Disclosures
This material is for general information only and is not intended to provide specific advice or recommendations for any individual. There is no assurance that the views or strategies discussed are suitable for all investors. To determine which investment(s) may be appropriate for you, please consult your financial professional prior to investing.
Investing involves risks including possible loss of principal. No investment strategy or risk management technique can guarantee return or eliminate risk.
Indexes are unmanaged and cannot be invested into directly. Index performance is not indicative of the performance of any investment and does not reflect fees, expenses, or sales charges. All performance referenced is historical and is no guarantee of future results.
This material was prepared by LPL Financial, LLC. All information is believed to be from reliable sources; however LPL Financial makes no representation as to its completeness or accuracy.
Unless otherwise stated LPL Financial and the third party persons and firms mentioned are not affiliates of each other and make no representation with respect to each other. Any company names noted herein are for educational purposes only and not an indication of trading intent or a solicitation of their products or services.
Asset Class Disclosures –
International investing involves special risks such as currency fluctuation and political instability and may not be suitable for all investors. These risks are often heightened for investments in emerging markets.
Bonds are subject to market and interest rate risk if sold prior to maturity.
Municipal bonds are subject and market and interest rate risk and potentially capital gains tax if sold prior to maturity. Interest income may be subject to the alternative minimum tax. Municipal bonds are federally tax-free but other state and local taxes may apply.
Preferred stock dividends are paid at the discretion of the issuing company. Preferred stocks are subject to interest rate and credit risk. They may be subject to a call features.
Alternative investments may not be suitable for all investors and involve special risks such as leveraging the investment, potential adverse market forces, regulatory changes and potentially illiquidity. The strategies employed in the management of alternative investments may accelerate the velocity of potential losses.
Mortgage backed securities are subject to credit, default, prepayment, extension, market and interest rate risk.
High yield/junk bonds (grade BB or below) are below investment grade securities, and are subject to higher interest rate, credit, and liquidity risks than those graded BBB and above. They generally should be part of a diversified portfolio for sophisticated investors.
Precious metal investing involves greater fluctuation and potential for losses.
The fast price swings of commodities will result in significant volatility in an investor’s holdings.
This research material has been prepared by LPL Financial LLC.
Not Insured by FDIC/NCUA or Any Other Government Agency | Not Bank/Credit Union Deposits or Obligations | Not Bank/Credit Union Guaranteed | May Lose Value
For Public Use – Tracking: #1131336
A Modern Framework for Portfolio Construction
UMAs for Flexibility and Customization
John Lohse | Portfolio Strategist, Model Portfolio Management
Last Updated: June 25, 2026
As client portfolios have grown in complexity —incorporating a mix of active and passive strategies, multiple managers, and a heightened focus on tax efficiency—the structure used to implement those portfolios has become increasingly important. Unified Managed Accounts (UMAs) have emerged as a compelling strategy, offering financial advisors a more integrated and scalable way to deliver diversified investment portfolios.
What Is a Unified Managed Account?
A Unified Managed Account is a single investment account that consolidates multiple types of investment strategies and vehicles into one coordinated structure. Within a UMA, an investor can hold separately managed accounts (SMAs), exchange-traded funds, mutual funds, and individual securities such as stocks and bonds. In a UMA, the entire portfolio is viewed and managed as a single entity.
This shift from a fragmented approach to an integrated one is foundational to understanding the benefits UMAs can provide.
The Benefits of Unifying
Historically, advisors often built portfolios by combining multiple standalone strategies, each housed in a separate account. While this approach allowed for diversification across managers and styles, it also introduced inefficiencies surrounding overlap, uncoordinated trade timing, fractured taxable record keeping, and complex portfolio management.
UMAs address these issues by centralizing implementation. Rather than managing each piece of the portfolio sporadically, the manager evaluates exposures, trades, and risks across the entire account at one time. This creates a more cohesive and intentional portfolio, better aligned with the client’s overall objectives.
Holistic Portfolio Construction
One of the most significant advantages of a UMA is the ability to construct and manage the portfolio holistically. Because all holdings reside in a single account, it allows for full visibility on a total portfolio basis. This gives more precise control over asset allocation, factor exposures, and concentration risks.
In practice, this means the portfolio is less likely to suffer from unintended duplication. For example, the manager would be able to more easily identify an overall domestic equity bias that might arise from the arrangement of multiple strategies, an unintended style tilt, or an income deficiency. In a UMA, those factors are more easily identified as the combination of strategies is homogenized into a single output. The result is a portfolio that better captures the original investment intent, with a stronger connection between the strategy being implemented and the outcomes delivered.
Tax Efficiency as a Structural Advantage
Tax management is another area where UMAs offer a significant advantage. Because all assets are held within a single account, tax optimization can occur across the entire portfolio rather than within isolated accounts.
Tax loss harvesting efficiencies are ever apparent under this structure. It furthers your options for immediate and concurrent loss harvesting (if available) when potentially realizing gains during rebalancing and trading. It also can go a long way in avoiding potential wash sale rule violations as it eliminates the disconnect between buying a security back too early between multiple accounts before the 30-day wash sale period has expired.
The ability to include SMAs into UMAs can also be a potent tool to potentially reduce overall taxable capital gains as each individual security within the SMA is eligible to be harvested if a loss is present. This differs from a standard fund where the individual components are aggregated at the fund level, and the advisor or overlay manager is unable to isolate specific securities for harvesting.
Ultimately, the UMA construct provides a full picture of tax impacts and opportunities to better serve client interests and after-tax returns.
The Building Blocks
As investor expectations continue to shift, the demand for more tailored portfolio strategies has grown. Clients increasingly seek portfolios that align with their individual preferences, whether that means avoiding certain securities, or leaning into preferred styles, geographies and risk preferences. Traditionally, building bespoke portfolios for each unique client circumstance would have been burdensome as complexities compound.
That’s where the “building block” components of UMAs shine. With a wide array of strategy offerings, a manager is able to assemble different components (building blocks) that fit the client’s goals into a single account. For example, does your client want domestic equity capital appreciation, individual stock exposure, and a long cycle risk mitigation component? Or what about municipal bond exposure with a core of an aggressive “go-anywhere” global equity exchange-traded fund (ETF) sleeve. Well, there’s an answer for that by combining individual building block strategies for each of those areas into the single UMA.
Each of those individual strategies serves as the building blocks of the total portfolio. With them, you get the optionality of customization, while maintaining portfolio management efficiencies. This flexibility enables advisors to offer more personalized portfolios while continuing to rely on model frameworks, external strategies, and centralized portfolio management. In doing so, it effectively extends a level of institutional-grade customization to a wider range of clients.
Final Thoughts
Unified Managed Accounts represent a significant investment management tool to drive client success. By consolidating multiple strategies into a single, coordinated structure, they allow advisors efficient flexibility and customization.
LPL Research remains committed to serving as your trusted investment partner. Advisors interested in incorporating UMAs and leveraging LPL Research’s building block model portfolios are encouraged to contact us. Investors should reach out to their LPL financial advisor for additional information and guidance.
There is no guarantee that a diversified portfolio will enhance overall returns or outperform a non-diversified portfolio. Diversification does not protect against market risk.
Asset allocation does not ensure a profit or protect against a loss.
Advisory accounts may not be appropriate for every investor. A brokerage account may be more appropriate if you prefer a buy-and-hold strategy for a long period of time.
Important Disclosures
This material is for general information only and is not intended to provide specific advice or recommendations for any individual. There is no assurance that the views or strategies discussed are suitable for all investors. To determine which investment(s) may be appropriate for you, please consult your financial professional prior to investing.
Investing involves risks including possible loss of principal. No investment strategy or risk management technique can guarantee return or eliminate risk.
Indexes are unmanaged and cannot be invested into directly. Index performance is not indicative of the performance of any investment and does not reflect fees, expenses, or sales charges. All performance referenced is historical and is no guarantee of future results.
This material was prepared by LPL Financial, LLC. All information is believed to be from reliable sources; however LPL Financial makes no representation as to its completeness or accuracy.
Unless otherwise stated LPL Financial and the third party persons and firms mentioned are not affiliates of each other and make no representation with respect to each other. Any company names noted herein are for educational purposes only and not an indication of trading intent or a solicitation of their products or services.
Asset Class Disclosures –
International investing involves special risks such as currency fluctuation and political instability and may not be suitable for all investors. These risks are often heightened for investments in emerging markets.
Bonds are subject to market and interest rate risk if sold prior to maturity.
Municipal bonds are subject and market and interest rate risk and potentially capital gains tax if sold prior to maturity. Interest income may be subject to the alternative minimum tax. Municipal bonds are federally tax-free but other state and local taxes may apply.
Preferred stock dividends are paid at the discretion of the issuing company. Preferred stocks are subject to interest rate and credit risk. They may be subject to a call features.
Alternative investments may not be suitable for all investors and involve special risks such as leveraging the investment, potential adverse market forces, regulatory changes and potentially illiquidity. The strategies employed in the management of alternative investments may accelerate the velocity of potential losses.
Mortgage backed securities are subject to credit, default, prepayment, extension, market and interest rate risk.
High yield/junk bonds (grade BB or below) are below investment grade securities, and are subject to higher interest rate, credit, and liquidity risks than those graded BBB and above. They generally should be part of a diversified portfolio for sophisticated investors.
Precious metal investing involves greater fluctuation and potential for losses.
The fast price swings of commodities will result in significant volatility in an investor’s holdings.
This research material has been prepared by LPL Financial LLC.
Not Insured by FDIC/NCUA or Any Other Government Agency | Not Bank/Credit Union Deposits or Obligations | Not Bank/Credit Union Guaranteed | May Lose Value
For Public Use – Tracking: #1130410
Oil Falls, Fed Stays Put: What is Next for Markets
The Tension Between Market Optimism and Policy Reality
LPL Research
Last Updated: June 24, 2026.
Today’s blog is written by Chris Fasciano, chief market strategist at Commonwealth. He represents Commonwealth in various media appearances, advisor speaking events, and Commonwealth conferences. He also oversees and mentors a dynamic team of investment research analysts who specialize in equity and fixed income markets. Prior to this role, Chris spent 10 years as one of the firm’s portfolio managers, involved with asset allocation and fund selection. With a deep background in small- and mid-cap stock research, Chris is uniquely positioned to analyze the latest economic data and offer valuable insights on navigating today’s volatile markets. Chris Fasciano is a guest writer and is not affiliated with LPL Financial.
Following last weekend’s announcement of a deal between the U.S. and Iran to bring the war in the Middle East to an end, markets rallied and oil prices dropped. This reaction is logical given that elevated oil prices have contributed to accelerating inflation data. However, the Federal Reserve’s (Fed) June meeting reinforced that inflation remains a primary concern for policy makers.
This dynamic highlights the competing forces that currently shape markets. On one hand, easing geopolitical risk and falling oil prices support optimism. On the other hand, persistent inflation keeps pressure on the Fed to potentially tighten monetary policy. These crosscurrents are likely to play a significant role in stock and bond performance over the remainder of the year.
The Positives of the Memorandum of Understanding
Investor focus has centered on the Memorandum of Understanding (MOU) between the U.S. and Iran, which provides a 60-day window to negotiate a final agreement. Initial discussions are already underway.
Markets quickly moved past what had been a major concern: that sustained higher oil prices would continue to drive inflation higher. That risk had stood in contrast to an otherwise supportive backdrop of strong corporate earnings and a stabilizing labor market.
At the center of the market’s reaction is the Strait of Hormuz. From an investor perspective, its reopening is the most consequential part of the agreement. If the Strait returns to full capacity within 30 days, oil prices are unlikely to remain a meaningful source of upward inflation pressure.
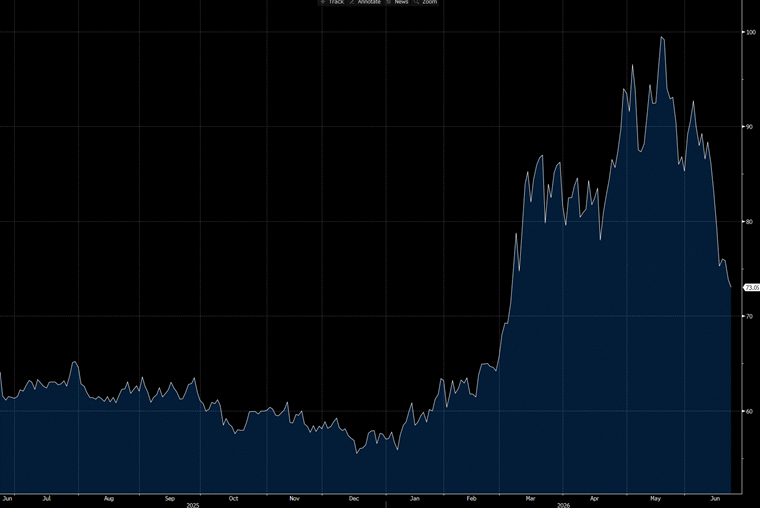
So far, markets appear confident. Oil prices have declined to levels not seen since early in the conflict, suggesting investors are already pricing in a normalization of supply.
West Texas Oil Prices Discounting a Return to Normal
Source: LPL Research, Bloomberg Year to date through June 22, 2026
Disclosures: Indexes are unmanaged and cannot be invested in directly. Past performance is no guarantee of future results. Estimates may not develop as predicted and are subject to change.
The “West Texas Oil Prices Discounting a Return to Normal” chart illustrates that market participants have a high degree of confidence that oil prices are headed lower over the remainder of the year. As of now, futures prices indicate oil will move below $70 per barrel in early 2027. This implies a broad expectation that recent supply disruptions will prove temporary rather than structural.
While this is encouraging for the inflation outlook, it does little to address the Fed’s near-term challenge.
The Federal Reserve’s Focus on the Present
The June Fed meeting — Chairman Kevin Warsh’s first — made it clear that policymakers remain firmly focused on inflation. Warsh reiterated the Fed’s commitment to its 2% inflation target and signaled little willingness to adjust policy based on recent declines in oil prices alone. Markets interpreted this as a hawkish shift.
Rates Poised to Rise
Source: LPL Research, CME Fedwatch 06-22-26
Disclosure: Past performance is no guarantee of future results.
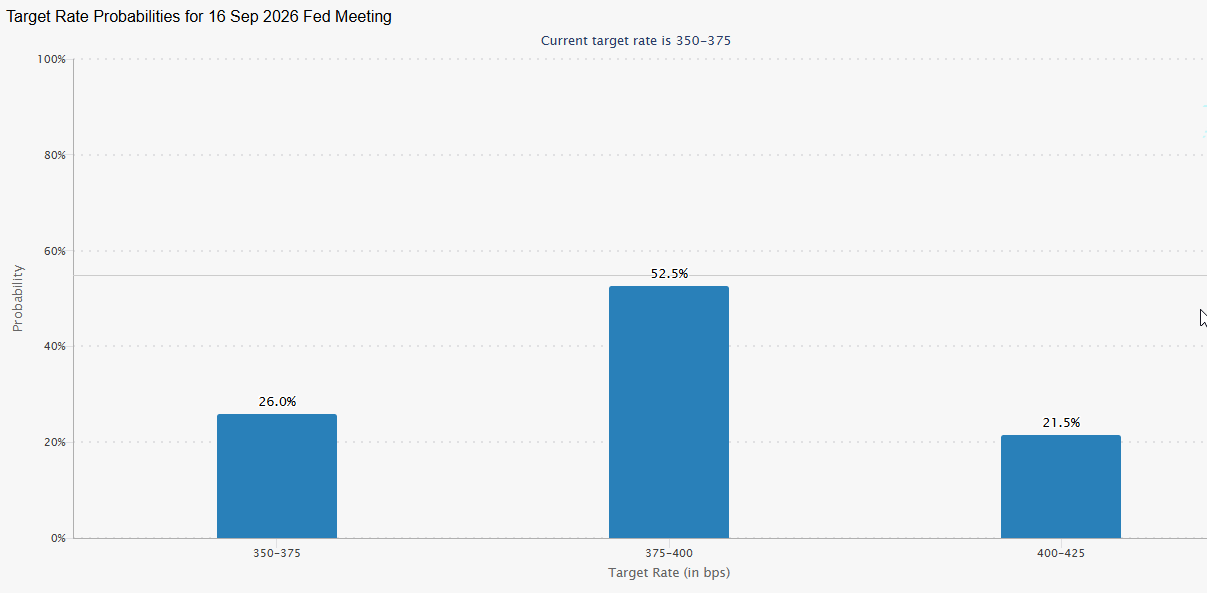
The “Rates Poised to Rise” chart shows that most market participants now believe that short-term interest rates will be higher by the end of the Fed’s September meeting.
But that was not the only thing that investors were left to think about after last week’s meeting. Chairman Warsh announced the formation of five tasks forces to look at various Fed policies and operations. These task forces will look at communication, balance sheet, reliance on existing data sources, productivity and jobs, and inflation frameworks.
Warsh has long believed that reform is necessary at the Fed and he clearly aims to deliver. The biggest impact from potential reforms for markets is that it appears a Warsh Fed will provide the market with less forward guidance. Warsh went as far as to say he could offer no guidance on what the Fed’s next move would be. While markets will adapt, reduced guidance could lead to increased volatility, particularly in interest rate-sensitive areas.
Those changes will take time to play out. In the meantime, investors need to navigate the positive sentiment of lower oil prices with what the Fed might do.
The Path Forward Most Likely Lies Somewhere in Between
If the Strait is open to full capacity within 30 days, then oil prices will remain low, prices for gas at the pump should trend downwards and ultimately supply chains will return to normal. It will certainly take time for consumer and producer prices to move back to their February levels but the momentum to do so should be in place.
If there is evidence that this is happening, then perhaps the Fed would be willing to look through short-term data when it comes to potentially raising interest rates. In that case, Wednesday’s reaction to Chairman Warsh’s first press conference would prove to be overly negative through the rearview mirror.
Earnings Continue to Hold the Key
Equity markets have rallied strongly from the March lows, with the S&P 500 gaining nearly 18%. Given ongoing uncertainty around geopolitics and Fed policy, near-term volatility would not be surprising.
Attention will soon turn to second-quarter earnings, where expectations are high. Analysts are projecting approximately 22% year-over-year growth for the S&P 500. While this raises the risk of disappointment, recent history suggests resilience. Over the past five quarters, companies have continued to deliver strong results despite policy and trade-related uncertainties. If earnings momentum continues, it should provide a foundation for markets over the longer term — even if volatility persists in the short term.
Also, despite all the excitement about the Space X (SPCX) initial public offering and the upcoming deals for Anthropic and Open AI, this has been a year for diversification across equity markets. The Russell 1000 large cap value index has outperformed its growth counterpart by 1,300 basis points. The small cap Russell 2000 also performed better than the S&P 500 by over 1,000 basis points. Finally, international stocks have continued to outperform U.S. stocks after a strong 2025.
Markets are navigating a balancing act: optimism around falling oil prices and easing geopolitical risk is colliding with a Federal Reserve still focused on inflation. History shows diversification remains the best way to navigate uncertainty about the future and yet still participate in any market upside due to strong earnings growth. And this year has been a reminder of exactly that.
Asset allocation does not ensure a profit or protect against a loss.
There is no guarantee that a diversified portfolio will enhance overall returns or outperform a non-diversified portfolio. Diversification does not protect against market risk.
Important Disclosures
This material is for general information only and is not intended to provide specific advice or recommendations for any individual. There is no assurance that the views or strategies discussed are suitable for all investors. To determine which investment(s) may be appropriate for you, please consult your financial professional prior to investing.
Investing involves risks including possible loss of principal. No investment strategy or risk management technique can guarantee return or eliminate risk.
Indexes are unmanaged and cannot be invested into directly. Index performance is not indicative of the performance of any investment and does not reflect fees, expenses, or sales charges. All performance referenced is historical and is no guarantee of future results.
This material was prepared by LPL Financial, LLC. All information is believed to be from reliable sources; however LPL Financial makes no representation as to its completeness or accuracy.
Unless otherwise stated LPL Financial and the third party persons and firms mentioned are not affiliates of each other and make no representation with respect to each other. Any company names noted herein are for educational purposes only and not an indication of trading intent or a solicitation of their products or services.
Asset Class Disclosures –
International investing involves special risks such as currency fluctuation and political instability and may not be suitable for all investors. These risks are often heightened for investments in emerging markets.
Bonds are subject to market and interest rate risk if sold prior to maturity.
Municipal bonds are subject and market and interest rate risk and potentially capital gains tax if sold prior to maturity. Interest income may be subject to the alternative minimum tax. Municipal bonds are federally tax-free but other state and local taxes may apply.
Preferred stock dividends are paid at the discretion of the issuing company. Preferred stocks are subject to interest rate and credit risk. They may be subject to a call features.
Alternative investments may not be suitable for all investors and involve special risks such as leveraging the investment, potential adverse market forces, regulatory changes and potentially illiquidity. The strategies employed in the management of alternative investments may accelerate the velocity of potential losses.
Mortgage backed securities are subject to credit, default, prepayment, extension, market and interest rate risk.
High yield/junk bonds (grade BB or below) are below investment grade securities, and are subject to higher interest rate, credit, and liquidity risks than those graded BBB and above. They generally should be part of a diversified portfolio for sophisticated investors.
Precious metal investing involves greater fluctuation and potential for losses.
The fast price swings of commodities will result in significant volatility in an investor’s holdings.
This research material has been prepared by LPL Financial LLC.
Not Insured by FDIC/NCUA or Any Other Government Agency | Not Bank/Credit Union Deposits or Obligations | Not Bank/Credit Union Guaranteed | May Lose Value
For Public Use – Tracking: #1129195
Summer Muni Technicals: A Reliable Tailwind?
Summer Seasonal Technicals in Municipal Bonds: A Reliable Tailwind?
Lawrence Gillum | Chief Fixed Income Strategist
Last Updated: June 23, 2026
Municipal bonds often see a seasonal lift during the summer months. This pattern, known as summer technicals, stems from a straightforward supply and demand imbalance that tends to favor bond prices. Over the past ten years, the summer months (May through July) have generally been positive months for the Bloomberg Municipal Bond Index, with monthly returns averaging +0.83%, +0.43%, and +0.82%, respectively.
In simple terms, summer brings lighter new issuance as many state and local governments, along with underwriters, slow their activity during vacation periods. At the same time, investors receive a wave of cash from coupon payments, maturing bonds, and redemptions. Much of that money gets reinvested back into the muni market. With fewer new bonds hitting the market and steady buying interest, the technical picture improves. This dynamic has shown up repeatedly over the years and can help offset broader rate volatility or support total returns even when macro conditions are mixed.
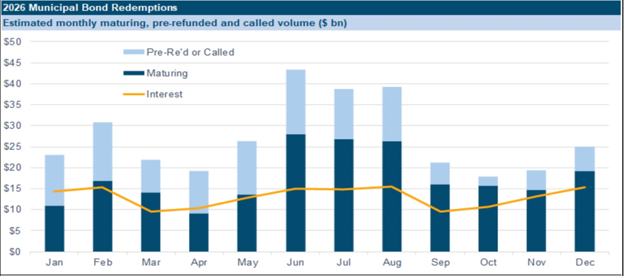
The pattern persists because it is rooted in predictable calendar-driven behavior rather than fleeting market sentiment. Issuers follow fiscal year cycles that often create mid-year cash flows around July 1. Reinvestment demand spikes as a result. Data from CreditSights outlines this year’s expected muni bond redemption schedule and shows June through August with the largest scheduled amount of maturing and/or called bonds. This organic demand helps support prices.
Summer Months Tend to See More Organic Demand
Source: LPL Research, CreditSights 05/29/26. Past performance is no guarantee of future results
So, will the summer technical hold this year as well? The setup looks constructive but not guaranteed. Issuance for the full year is running at a high pace overall, which could limit how pronounced the summer lull becomes compared with lighter years. Still, reinvestment flows are expected to provide meaningful support. Attractive starting yields and a relatively steep muni curve add another layer of appeal. If broader rates stay range-bound or ease modestly, the seasonal bid could help drive positive performance through the summer and into fall (no guarantees of course).
Investors should not treat this as a sure thing every year. Heavy supply years or sharp rate spikes can blunt the effect. That said, the summer technical has been durable enough to warrant attention as one factor in positioning. For tax-sensitive portfolios holding munis, it offers a seasonal reason to stay patient through any near-term volatility rather than chasing timing moves. Moreover, we would use any back up in yields to add to positioning.
The combination of solid fundamentals, income levels near multi-year highs, and these recurring technical supports makes the asset class worth monitoring closely as summer unfolds.
Important Disclosures
This material is for general information only and is not intended to provide specific advice or recommendations for any individual. There is no assurance that the views or strategies discussed are suitable for all investors. To determine which investment(s) may be appropriate for you, please consult your financial professional prior to investing.
Investing involves risks including possible loss of principal. No investment strategy or risk management technique can guarantee return or eliminate risk.
Indexes are unmanaged and cannot be invested into directly. Index performance is not indicative of the performance of any investment and does not reflect fees, expenses, or sales charges. All performance referenced is historical and is no guarantee of future results.
This material was prepared by LPL Financial, LLC. All information is believed to be from reliable sources; however LPL Financial makes no representation as to its completeness or accuracy.
Unless otherwise stated LPL Financial and the third party persons and firms mentioned are not affiliates of each other and make no representation with respect to each other. Any company names noted herein are for educational purposes only and not an indication of trading intent or a solicitation of their products or services.
Asset Class Disclosures –
International investing involves special risks such as currency fluctuation and political instability and may not be suitable for all investors. These risks are often heightened for investments in emerging markets.
Bonds are subject to market and interest rate risk if sold prior to maturity.
Municipal bonds are subject and market and interest rate risk and potentially capital gains tax if sold prior to maturity. Interest income may be subject to the alternative minimum tax. Municipal bonds are federally tax-free but other state and local taxes may apply.
Preferred stock dividends are paid at the discretion of the issuing company. Preferred stocks are subject to interest rate and credit risk. They may be subject to a call features.
Alternative investments may not be suitable for all investors and involve special risks such as leveraging the investment, potential adverse market forces, regulatory changes and potentially illiquidity. The strategies employed in the management of alternative investments may accelerate the velocity of potential losses.
Mortgage backed securities are subject to credit, default, prepayment, extension, market and interest rate risk.
High yield/junk bonds (grade BB or below) are below investment grade securities, and are subject to higher interest rate, credit, and liquidity risks than those graded BBB and above. They generally should be part of a diversified portfolio for sophisticated investors.
Precious metal investing involves greater fluctuation and potential for losses.
The fast price swings of commodities will result in significant volatility in an investor’s holdings.
This research material has been prepared by LPL Financial LLC.
Not Insured by FDIC/NCUA or Any Other Government Agency | Not Bank/Credit Union Deposits or Obligations | Not Bank/Credit Union Guaranteed | May Lose Value
For Public Use – Tracking: #1128454
Weekly Market Commentary | Kevin Warsh Could Shake Up the Fed | June 22, 2026
LPL Research examines Warsh’s evolving Fed approach, infrastructure-led growth, and the impact of China demand on oil prices.
A hawkish debut. At his first Federal Open Market Committee (FOMC) meeting, Chair Kevin Warsh paired a hawkish, minimalist tone — tersely emphasizing price stability — with the launch of five task forces to review key aspects of Federal Reserve (Fed) policy. Many Fed governors want to follow the Bank of Japan’s lead and hike rates in the near term.
Uncertainty in projections. While officials’ projections show a split on future rate hikes and a higher path for rates, alongside elevated inflation forecasts, uncertainty remains high, underscored by Warsh’s decision not to submit projections. Importantly, with inflation seen as partly supply-driven, the Fed could turn less hawkish if geopolitical tensions ease.
Constructive ambiguity and growth. Overall, the Fed appears to be shifting back toward “constructive ambiguity,” with the outlook hinging on Middle East developments and a steady, near-trend growth backdrop supported by investment and productivity gains. We believe the ongoing infrastructure buildout is supporting growth, while weaker demand from China is weighing on oil prices.
To understand the drivers underneath the outlook, reference the newly-released Economic Navigator.
Did He Just Provide the Forward Guidance He Doesn’t Like?
Kevin Warsh, the new chairman of the FOMC, has long been critical of forward guidance, which is the Fed’s practice of explicitly signaling the future path of interest rates (e.g., “rates will stay low for an extended period” or publishing a projected path for policy rates). His concern is that the guidance could give the impression that policymakers might have a high degree of confidence about the future path of the economy and rates. Warsh tends to view this as misleading since macroeconomic conditions, especially inflation shocks, are inherently uncertain, so locking in a path risks being wrong.
If the Fed preps investors for a particular path and conditions change, backing away can damage credibility. Warsh prefers keeping his options open without “pre-committing” to a trajectory.
Heavy forward guidance encourages markets to anchor too tightly to Fed signals instead of underlying data, which can distort financial conditions and create volatility when guidance shifts.
Even though Warsh favors minimalist, “constructive ambiguity”-style communication, releasing a dot plot within the Summary of Economic Projections (SEP) still functions as forward guidance. As of now, the updated dots show a higher median rate (and a split committee) that tells investors rates may need to rise from here or stay higher for longer. Markets interpreted this as directional guidance, which explains the negative reaction in both the equity and bond markets after the meeting.
Moving Toward a More Implicit Guidance
So, to answer the initial question, Warsh may have given us the version of forward guidance he prefers. Warsh rejects strong, explicit forward guidance, but he is still using a lighter, more conditional version via projections. The shift is toward guidance with less verbal commitment, more data-dependency, and built-in ambiguity.
The Shake-Up: Five New Task Forces
Chair Kevin Warsh announced five task forces aimed at modernizing key pillars of Fed policymaking — covering data collection and usage, AI and productivity, communications (including a potential overhaul of the Summary of Economic Projections), the inflation framework, and balance sheet strategy — reflecting a broad effort to address both structural and credibility challenges facing the institution. These task forces are expected to be composed of a mix of Federal Reserve Board staff, regional Fed bank economists, and outside experts from academia, technology, and financial markets, signaling a more open, cross-disciplinary approach to policy design. This could yield very good fruit. By combining internal institutional knowledge with external perspectives, Warsh appears to be seeking both technical improvements (e.g., better measurement of productivity and inflation dynamics) and a retooling of how the Fed communicates and implements policy.
Despite initially creating some unwelcome volatility, we think these five committees may introduce some real improvements. Some of the methodologies on both data collection and analysis could be improved with the help of modern technologies, and the shake-up may nudge the Fed, our country’s third attempt at central banking, into a more credible and helpful institution.
Central Bank Rates Are Slowly Converging
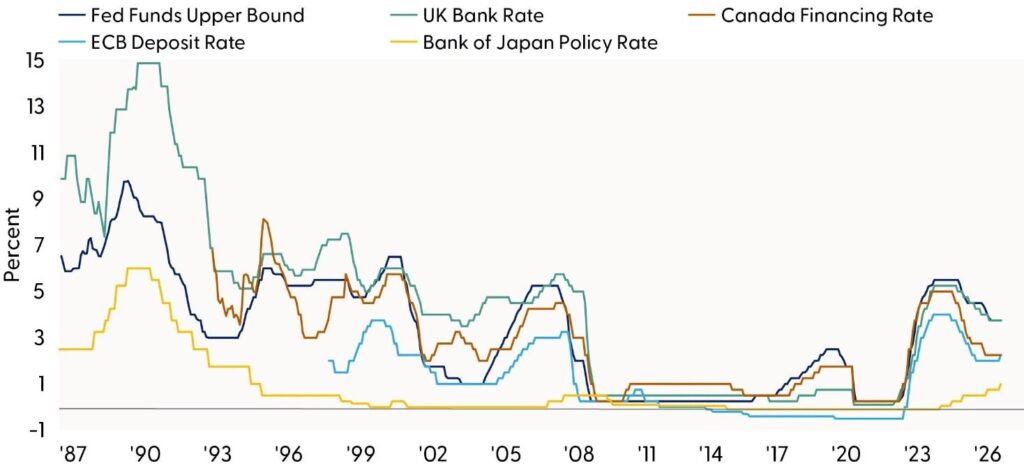
Last week’s attention was mostly on the Fed and its upwardly revised dot plot, but other central banks deserve some attention. The Bank of Japan’s (BOJ) recent decision to hike rates reflects a notable shift after years of ultra‑easy policy, driven by stronger domestic inflation dynamics and rising wage growth, which signal that Japan is finally moving away from persistent deflation. Policymakers are increasingly worried that inflation is becoming more persistent, particularly as firms pass through higher costs and wages begin to support demand, warranting the hike. We expect global central bank policy rates will begin to converge, as the Middle East conflict is creating a shared, supply-driven inflation shock — primarily through higher energy and shipping costs — that is affecting both advanced and emerging economies.
Unlike prior cycles where inflation pressures diverged across regions, this shock is more synchronized, pushing central banks — even those at very different starting points like the BOJ and the Fed — toward a closer policy stance. As long as geopolitical tensions keep global cost pressures elevated, the dispersion in policy rates is likely to narrow, reinforcing the theme of convergence in global monetary policy.
Bank of Japan is Playing Catchup
Source: LPL Research, Bank of Canada, Bank of England, Bank of Japan, European Central Bank, Federal Reserve Board 06/22/26 Disclosures: Past performance is no guarantee of future results.
What Happens After the Iran War Ends?
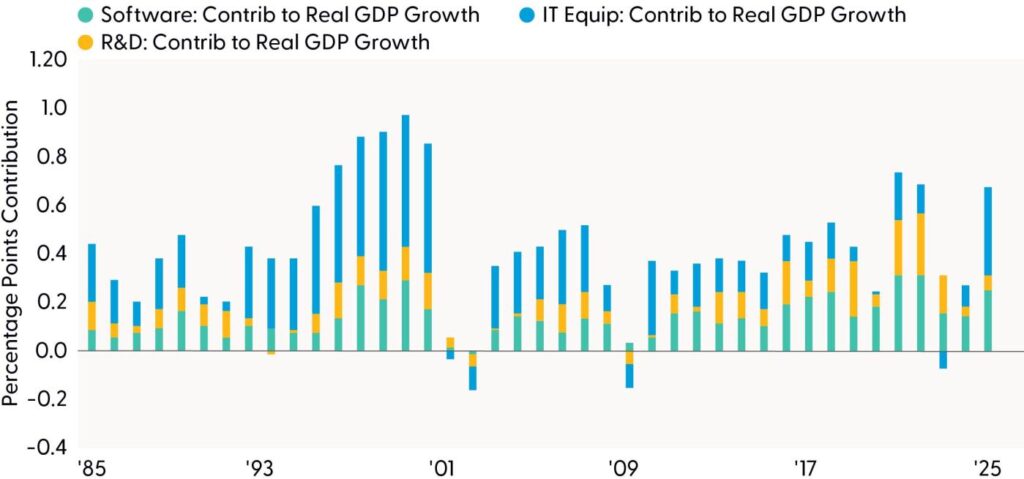
After geopolitical tensions ease, we expect the Fed to examine the underlying drivers of growth more closely, with a particular focus on whether business investment — especially in AI-related infrastructure — is generating sustained momentum rather than a temporary cycle boost. Capital spending tied to data centers, semiconductors, and digital infrastructure has emerged as a key support for productivity and potential output, suggesting growth could remain near trend even amid tighter financial conditions. If these investments translate into measurable productivity gains, the Fed may view this expansion as more durable and less inflationary, shaping a more balanced policy response over time. We know from earlier speeches that Chair Warsh believed AI would boost productivity and help relieve inflation pressures.
There’s More Room To Go With Infrastructure Buildout
Source: LPL Research, U.S. Bureau of Economic Analysis, 06/22/26
Disclosures: Past performance is no guarantee of future results.
Will Oil Prices Return to Pre-War Levels? It Depends on China’s Economic Growth
One of the key questions for investment professionals is whether oil prices will return to pre-war levels once the Middle East crisis is resolved. At the same time, many are asking why oil prices are not higher, especially since the latest U.S.–Iran deal recently pushed crude to its lowest level since the initial attack. More than 100 days after the war in Iran disrupted the Strait of Hormuz, oil prices remain surprisingly contained, and one such reason could be China’s sharp pullback from the crude market. According to Vortexa data, Chinese crude imports by tanker fell to 6.7 million barrels a day last month, nearly 40% below the 2025 average. 1 That reduction — roughly 4 million barrels a day — is enormous, equal to the combined oil consumption of Germany and France. This could be the central factor keeping prices below $100 a barrel, as Beijing has somehow slashed imports without obvious economic damage other than a slowdown in year-over-year gross domestic product (GDP) from 5% in Q1 to 4.6% in Q2.
China Imported Surprisingly Less Oil Last Month
Source: LPL Research, China General Administration of Customs 06/22/26
Disclosures: Past performance is no guarantee of future results.
Chinese retrenchment has helped offset what would normally be a major supply shock. Even with the Strait of Hormuz effectively closed, oil has continued to leave the Gulf through Saudi and UAE pipelines and tanker shuttle operations. At the same time, the market entered the conflict with a sizable surplus, strategic reserves are being released at a record pace, and global refinery runs have fallen as demand weakens, especially in petrochemicals.
China is the key variable. Some price-suppressing forces, such as emergency stock releases and inventory drawdowns, are temporary. The central question is how long Beijing can continue importing so little crude. If Chinese buying returns before supply risks ease, oil’s next move could look very different.
Other factors have also dampened the oil price response. Refineries are more flexible than in past crises, allowing them to adjust crude slates and product output. Production growth in the Americas, including Brazil, Guyana, the U.S., and China, has added to supply. Meanwhile, traders have increasingly hedged geopolitical risk through options rather than physical oil purchases, and better satellite imagery and tanker tracking have reduced the fog of war.
But Do We Really Understand Tanker Activity?
It depends on how accurately we can track vessels.
The familiar model of maritime monitoring, the Automatic Identification System (AIS) signal, breaks down when geopolitics enter the picture. In places such as the Strait of Hormuz and the Red Sea, vessel movements help us assess crude flows and potential market disruptions. But that evidence can be incomplete, delayed, spoofed, or deliberately obscured.
The stakes are especially high in the Strait of Hormuz, one of the world’s most important oil chokepoints. A tanker tracked through the strait may appear to be a simple line on a map, but in a crisis it becomes a market-sensitive claim about whether oil is moving, whether a cargo is stalled, whether a sanctioned ship transited, or whether traders should price in disruption.
Several categories of maritime risk now shape the operating environment. “Dark vessels” could disappear from normal visibility to conceal port calls, route changes, or ship-to-ship transfers. “Spoofing” involves false position signals that can make a vessel appear somewhere it is not. “Shadow fleets” describe opaque networks of vessels that move sanctioned commodities.
In contested waters, the vessel track is only valuable if it is to be trusted. For energy markets, false signals can quickly become false narratives about supply, disruption, or sanctions risk.
Concluding Thoughts
Ultimately, whether oil prices return to pre-war levels depends on both the formal resolution of the Middle East crisis and the durability of China’s demand slowdown. China’s unusually steep reduction in crude imports, as shown in the “China Imported Surprisingly Less Oil Last Month” chart, has absorbed a large share of the supply shock, but that cushion may prove temporary if economic activity reaccelerates, inventories are rebuilt, or Beijing resumes normal buying patterns. At the same time, today’s oil market is pricing not only barrels, but also information quality. Tanker flows, shadow-fleet activity, spoofed signals, and dark vessels can all distort the narrative around supply risk. For now, surplus inventories, strategic reserve releases, flexible refineries, hopeful political deals, and weaker Chinese demand have kept crude prices contained. But if China’s growth strengthens before geopolitical risks fully fade, and if vessel-tracking data becomes harder to trust, the market could quickly shift from complacency back toward scarcity pricing.
Asset Allocation Insights
The LPL Research Strategic and Tactical Asset Allocation Committee (STAAC) maintains its recommendation for a tactical equity overweight and fixed income underweight. While maintaining our equity and U.S. equity overweights, the Committee favors neutral style exposure because of stretched market positioning and technical indicators following the recent growth-led rally. As such, this view is expressed via a defensive factor tilt given our expectation for bouts of volatility until the macro backdrop begins to improve as the situation in the Strait of Hormuz eventually plays out to a resolution, allowing markets to refocus on a broadly healthy fundamental landscape.
Important Disclosures
This material is for general information only and is not intended to provide specific advice or recommendations for any individual. There is no assurance that the views or strategies discussed are suitable for all investors or will yield positive outcomes. Investing involves risks including possible loss of principal. Any economic forecasts set forth may not develop as predicted and are subject to change.
References to markets, asset classes, and sectors are generally regarding the corresponding market index. Indexes are unmanaged statistical composites and cannot be invested into directly. Index performance is not indicative of the performance of any investment and do not reflect fees, expenses, or sales charges. All performance referenced is historical and is no guarantee of future results.
Any company names noted herein are for educational purposes only and not an indication of trading intent or a solicitation of their products or services. LPL Financial doesn’t provide research on individual equities.
All information is believed to be from reliable sources; however, LPL Financial makes no representation as to its completeness or accuracy.
All investing involves risk, including possible loss of principal.
US Treasuries may be considered “safe haven” investments but do carry some degree of risk including interest rate, credit, and market risk. Bonds are subject to market and interest rate risk if sold prior to maturity. Bond values will decline as interest rates rise and bonds are subject to availability and change in price.
The Standard & Poor’s 500 Index (S&P500) is a capitalization-weighted index of 500 stocks designed to measure performance of the broad domestic economy through changes in the aggregate market value of 500 stocks representing all major industries.
The PE ratio (price-to-earnings ratio) is a measure of the price paid for a share relative to the annual net income or profit earned by the firm per share. It is a financial ratio used for valuation: a higher PE ratio means that investors are paying more for each unit of net income, so the stock is more expensive compared to one with lower PE ratio.
Earnings per share (EPS) is the portion of a company’s profit allocated to each outstanding share of common stock. EPS serves as an indicator of a company’s profitability. Earnings per share is generally considered to be the single most important variable in determining a share’s price. It is also a major component used to calculate the price-to-earnings valuation ratio.
All index data from FactSet or Bloomberg. All index data from FactSet or Bloomberg.
This research material has been prepared by LPL Financial LLC.
Not Insured by FDIC/NCUA or Any Other Government Agency | Not Bank/Credit Union Guaranteed | Not Bank/Credit Union Deposits or Obligations| May Lose Value
For public use.
Member FINRA/SIPC.
RES-0007122-0526 Tracking #1127346 | #1127347 (Exp. 06/27)
Weekly Market Performance | June 18, 2026
LPL Research
Last Updated: June 18, 2026
LPL Research provides its Weekly Market Performance for the week of June 15, 2026. U.S. stocks printed modest gains over the holiday-shortened week with easing geopolitical tensions and central bank signals driving sentiment. Equities were supported by progress toward a U.S.–Iran agreement that lowered oil prices and boosted risk appetite, though gains were tempered midweek by hawkish Federal Reserve takeaways. International markets also benefited from lower energy prices amid local central bank decisions. In fixed income, bonds rose despite Fed-driven volatility, while the U.S. dollar strengthened.
Stock Index Performance
| Index | Week-Ending | One Month | Year to Date |
| S&P 500 | 0.81% | 1.20% | 9.44% |
| Dow Jones Industrial | 0.85% | 3.93% | 7.44% |
| Nasdaq Composite | 2.14% | 1.35% | 13.77% |
| Russell 2000 | 0.73% | 6.86% | 19.48% |
| MSCI EAFE | -0.59% | 1.70% | 8.72% |
| MSCI EM | 4.24% | 8.91% | 29.34% |
S&P 500 Index Sectors
| Sector | Week-Ending | One Month | Year to Date |
| Materials | -0.15% | 2.97% | 12.99% |
| Utilities | 0.31% | 1.47% | 4.05% |
| Industrials | 2.65% | 5.83% | 16.36% |
| Consumer Staples | -2.74% | -4.77% | 7.31% |
| Real Estate | -3.29% | -0.05% | 8.83% |
| Health Care | -2.76% | 2.59% | -3.66% |
| Financials | 0.56% | 3.58% | -2.33% |
| Consumer Discretionary | 0.48% | -1.58% | -1.39% |
| Information Technology | 2.89% | 4.29% | 20.86% |
| Communication Services | 1.09% | -6.72% | 3.89% |
| Energy | -6.57% | -11.75% | 18.61% |
Fixed Income and Commodities
| Indexes and Commodities | Week-Ending | One Month | Year to Date |
| Bloomberg U.S. Aggregate | -0.09% | 0.98% | 0.26% |
| Bloomberg Credit | -0.07% | 1.17% | 0.55% |
| Bloomberg Munis | 0.27% | 1.37% | 1.90% |
| Bloomberg High Yield | 0.06% | 0.93% | 1.77% |
| Oil | -9.71% | -29.47% | 33.47% |
| Natural Gas | 3.59% | 6.88% | -12.32% |
| Gold | 0.05% | -7.56% | -2.27% |
| Silver | -3.08% | -15.17% | -8.00% |
Source: LPL Research, Bloomberg 6/18/26 @ 2:55 p.m. ET
Disclosures: Indexes are unmanaged and cannot be invested in directly.
U.S. and International Equities
U.S. Equities: Major U.S. equity averages posted moderate gains over the holiday-shortened week after facing a couple of major drivers — in both directions — over the last four trading sessions. The S&P 500 picked up right where it left off late last week, printing a strong Monday session following reports that Washington and Tehran were set for an interim agreement to end the conflict in Iran and reopen the Strait of Hormuz, to be signed on Friday. The news sparked a plunge in crude futures, which dampened investor concerns around economic impacts of the war and buoyed risk appetite. However, market participants took a breather leading up to Wednesday’s Federal Reserve (Fed) rate decision, refraining from outsized bets ahead of Chairman Kevin Warsh’s inaugural meeting, while analyzing implementation of the U.S.-Iran truce.
Equity benchmarks wiped out week-to-date gains Wednesday as the mood across Wall Street turned risk-off on hawkish-leaning takeaways from the Fed’s rate hold, with roughly half of policymakers penciling in at least one rate hike this year. Nonetheless, a Thursday bounce put stocks back in positive territory after the White House inked its preliminary agreement with Iran a day earlier than expected, spurring optimism of easing inflation risks with the Strait of Hormuz expected to reopen. Chipmaker strength also aided gains on news of a chip design partnership between Apple (AAPL) and Intel (INTC).
International Equities: The European benchmark STOXX 600 Index was modestly higher on the week at Thursday’s close after scoring its first record high since the start of the Iran conflict earlier in the week. Tumbling oil prices were flagged as a tailwind for the region, sending energy companies lower as investors turned to economically sensitive corners of the market on easing inflation and economic growth concerns. Attention also landed on central bank policy, as hawkish takeaways from Wednesday’s Fed decision took some wind out of the risk-on sails, while U.K. shares underperformed after dropping on two dissents for rate hikes in the Bank of England’s Thursday decision to leave rates unchanged.
Asian equities paced a mostly higher week through Thursday trading with sentiment broadly lifted by hopes that the U.S.-Iran deal will meaningfully alleviate supply chain pressure across the region. AI-related names continued to outperform amid the stronger risk appetite, with South Korea charging higher on the back of chipmaker SK Hynix. But the biggest story of the week was the Bank of Japan delivering on expectations of a rate hike, which supported banking shares, while sliding oil prices lifted hopes of reduced pressure on corporate margins. Greater China remained under pressure, as Hong Kong tech shares continued to dent benchmarks. A contraction in Chinese consumer spending for the first time since the pandemic and property stocks dropping to near pre-2024 stimulus levels dampened the macro backdrop.
Fixed Income, Currency, and Commodity Markets
Fixed Income: Core bonds, as measured by the Bloomberg Aggregate Index, traded higher over the last four days after reversing post-Fed meeting losses. Wednesday’s monetary policy meeting was decidedly hawkish, with nine of the 18 Fed officials suggesting at least one rate hike was likely in 2026 with six officials suggesting two hikes could be necessary. As a result of the hawkish shift, front end Treasury yields sold off in concert with the expectation of additional rate hikes, while the back end was largely flat to barely higher. As such, the yield curve (proxied by the difference in 2-year and 10-year yields) collapsed to its flattest level since early 2025. That trend continued Thursday morning with the 2Y/10Y curve at 25 basis points. Also, market-implied inflation expectations (per Treasury Inflation-Protected Securities (TIPS) breakevens) have fallen to levels to suggest that the Fed will get back to its 2% inflation target sometime over the next two years.
Kevin Warsh’s first Fed meeting as chair was unexpectedly hawkish but provided additional credibility that the central bank was serious about getting inflation under control. And further flattening of the curve reinforces our view that there is very little additional compensation to own longer-maturity Treasury yields at this point. The back up in front-end yields, though, provides additional income for income-oriented investors as the 1–5-year parts of the Treasury curve have become even more attractive. Finally, given the collapse in TIPS breakevens, the bar to invest in TIPS has fallen as well.
Commodities and Currencies: The broader commodity complex traded lower on the week, weighed down by double-digit losses in crude oil. West Texas Intermediate (WTI) crude futures sank near their lowest levels since the early days of the U.S.-Iran conflict, stringing together consecutive losses as traders awaited the expected interim peace deal. Prices extended declines Thursday as markets reacted to the memorandum of understanding entering effect and energy transport traffic beginning to trickle through the Strait of Hormuz. However, given inventory levels remaining tight, volatility is likely to continue. Elsewhere, gold prices were on track for a slight gain, paring its week-to-date advance after Wednesday’s hawkish Fed meeting boosted market pricing for a 2026 rate hike, which would raise opportunity costs for the non-yielding bullion. In currencies, the dollar took the spotlight after nearing one-year highs on the Fed’s hawkish tilt, sending the U.S. dollar/Japanese yen cross rate to its critical level of 160 and sparking intervention chatter for the Japanese currency.
Economic Weekly Roundup
New Fed Chair Plans to Shake Things Up
- At the Federal Open Market Committee (FOMC) press conference, Kevin Warsh announced five task forces, drawing on both internal and external expertise, to reassess key pillars of Fed policy: data collection and usage, AI and productivity, communications (including a revamp of the Summary of Economic Projections), the inflation framework, and the balance sheet.
- For his first meeting, Chair Warsh opted to keep things at a minimum, including the length of that last sentence. “The Committee will deliver price stability.” Given the parting sentence about the Committee’s commitment, we see this as hawkish delivery.
- But since current inflation is supply-driven, we should expect a less hawkish view on policy once the Middle East conflict ends. (A bit of forward guidance here.)
- Rate projections show officials split over whether to raise interest rates by the end of 2026, with nine of 18 officials penciling in a rate hike and the median rate forecast drifting up to 3.75% from 3.4% in March. The median has rates falling to 3.6% in 2027.
- Chairman Warsh did not submit any projections, and a second official withheld a rate forecast for 2028, illustrating the challenging times we are facing.
- Fed officials see core inflation at 3.3% by the end of 2026, up from the 2.7% forecasted in March; and GDP growth of 2.2%, compared with 2.4% previously. We think inflation could surprise us to the downside if geopolitics improves sooner rather than later.
Bottom Line: We are going back to the days of Alan Greenspan when FOMC statements were deliberately minimalist and opaque (“constructive ambiguity”). The dominant uncertainty stems from the Middle East conflict; as it fades, the focus will turn to the resilience of capital investment, and the productivity gains it is generating — both of which indicate economic growth is tracking near trend.
The Week Ahead
The following economic data is slated for the week ahead:
- Monday: No economic releases scheduled
- Tuesday: ADP Weekly Employment Change (Jun 6), Philadelphia Fed Non-Manufacturing Activity (Jun), S&P Global U.S. Manufacturing, Services, and Composite PMI (Jun preliminary), Richmond Fed Manufacturing Index and Business Conditions (Jun)
- Wednesday: MBA Mortgage Applications (Jun 19), Current Account Balance (1Q), New Home Sales (May), Building Permits (May final)
- Thursday: Personal Income and Spending (May), Chicago Fed National Activity Index (May), Headline and Core PCE Price Index (May), Durable Goods Orders (May preliminary), Initial Jobless Claims (Jun 20), Capital Goods Orders and Shipments (May preliminary), Continuing Claims (Jun 13), GDP (1Q third reading), Personal Consumption (1Q third reading), Core PCE Price Index (1Q third reading), Kansas City Fed Manufacturing Activity (Jun)
- Friday: Advance Goods Trade Balance (May), Retail Inventories (May), Wholesale Inventories (May preliminary), University of Michigan Consumer Sentiment Report (Jun final), Kansas City Fed Services Activity (Jun)
Important Disclosures
This material is for general information only and is not intended to provide specific advice or recommendations for any individual. There is no assurance that the views or strategies discussed are suitable for all investors. To determine which investment(s) may be appropriate for you, please consult your financial professional prior to investing.
Investing involves risks including possible loss of principal. No investment strategy or risk management technique can guarantee return or eliminate risk.
Indexes are unmanaged and cannot be invested into directly. Index performance is not indicative of the performance of any investment and does not reflect fees, expenses, or sales charges. All performance referenced is historical and is no guarantee of future results.
This material was prepared by LPL Financial, LLC. All information is believed to be from reliable sources; however LPL Financial makes no representation as to its completeness or accuracy.
Unless otherwise stated LPL Financial and the third party persons and firms mentioned are not affiliates of each other and make no representation with respect to each other. Any company names noted herein are for educational purposes only and not an indication of trading intent or a solicitation of their products or services.
Asset Class Disclosures –
International investing involves special risks such as currency fluctuation and political instability and may not be suitable for all investors. These risks are often heightened for investments in emerging markets.
Bonds are subject to market and interest rate risk if sold prior to maturity.
Municipal bonds are subject and market and interest rate risk and potentially capital gains tax if sold prior to maturity. Interest income may be subject to the alternative minimum tax. Municipal bonds are federally tax-free but other state and local taxes may apply.
Preferred stock dividends are paid at the discretion of the issuing company. Preferred stocks are subject to interest rate and credit risk. They may be subject to a call features.
Alternative investments may not be suitable for all investors and involve special risks such as leveraging the investment, potential adverse market forces, regulatory changes and potentially illiquidity. The strategies employed in the management of alternative investments may accelerate the velocity of potential losses.
Mortgage backed securities are subject to credit, default, prepayment, extension, market and interest rate risk.
High yield/junk bonds (grade BB or below) are below investment grade securities, and are subject to higher interest rate, credit, and liquidity risks than those graded BBB and above. They generally should be part of a diversified portfolio for sophisticated investors.
Precious metal investing involves greater fluctuation and potential for losses.
The fast price swings of commodities will result in significant volatility in an investor’s holdings.
This research material has been prepared by LPL Financial LLC.
Not Insured by FDIC/NCUA or Any Other Government Agency | Not Bank/Credit Union Deposits or Obligations | Not Bank/Credit Union Guaranteed | May Lose Value
For Public Use – Tracking: #1127991
China’s Lower Oil Imports Weigh on Prices
Low Chinese Demand for Foreign Oil Keeping Prices Low
Dr. Jeffrey Roach | Chief Economist
Will Oil Prices Return to Pre-War Levels? It Depends on China’s Economic Growth
One of the key questions for investment professionals is whether oil prices will return to pre-war levels once the Middle East crisis is resolved. At the same time, many are asking why oil prices are not higher, especially since the latest geopolitical deal recently pushed crude to its lowest level since the initial attack. More than 100 days after the war in Iran disrupted the Strait of Hormuz, oil prices remain surprisingly contained, and one such reason could be China’s sharp pullback from the crude market. According to Vortexa data, Chinese crude imports by tanker fell to 6.7 million barrels a day last month, nearly 40% below the 2025 average1. That reduction — roughly 4 million barrels a day — is enormous, equal to the combined oil consumption of Germany and France. This could be the central factor keeping prices below $100 a barrel, as Beijing has somehow slashed imports without obvious economic damage other than a slowdown in year over year gross domestic product (GDP) from 5% in Q1 to 4.6% in Q2.
China Imported Surprisingly Less Oil Last Month
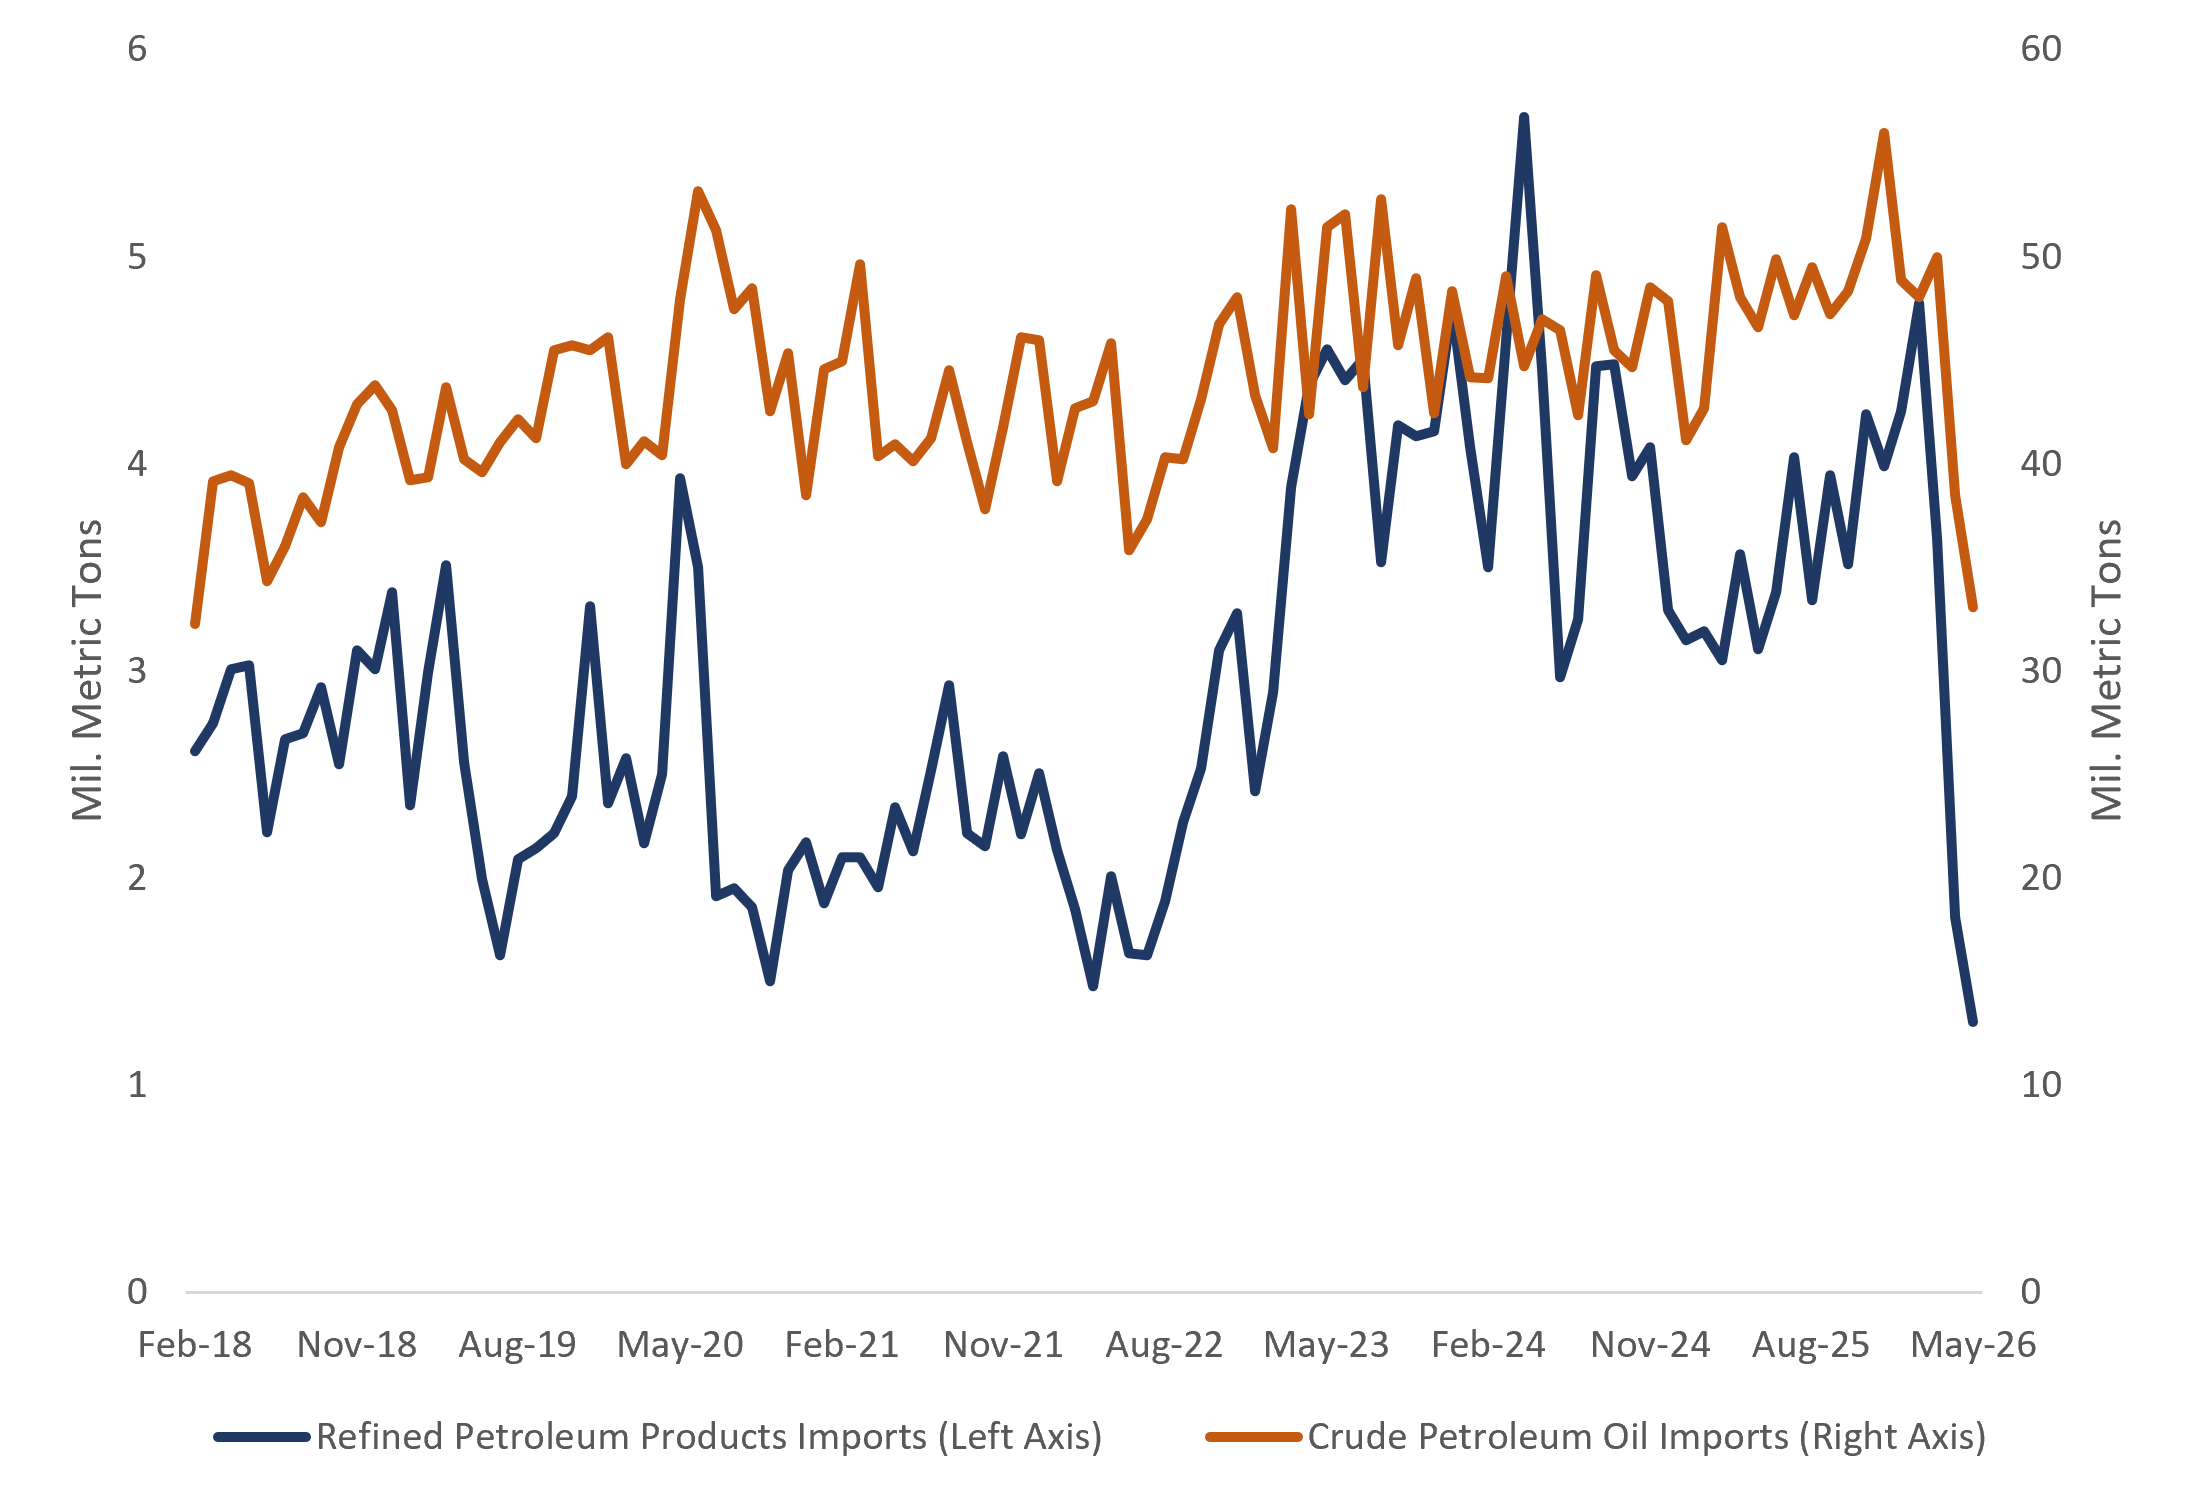
Source: LPL Research, China General Administration of Customs 06/17/26
Disclosure: Past performance is no guarantee of future results.
Chinese retrenchment has helped offset what would normally be a major supply shock. Even with the Strait of Hormuz effectively closed, oil has continued to leave the Gulf through Saudi and UAE pipelines and tanker shuttle operations. At the same time, the market entered the conflict with a sizable surplus, strategic reserves are being released at a record pace, and global refinery runs have fallen as demand weakens, especially in petrochemicals.
China is the key variable. Some price-suppressing forces, such as emergency stock releases and inventory drawdowns, are temporary. The central question is how long Beijing can continue importing so little crude. If Chinese buying returns before supply risks ease, oil’s next move could look very different.
Other factors have also dampened the oil price response. Refineries are more flexible than in past crises, allowing them to adjust crude slates and product output. Production growth in the Americas, including Brazil, Guyana, the U.S. and China, has added supply. Meanwhile, traders have increasingly hedged geopolitical risk through options rather than physical oil purchases, and better satellite imagery and tanker tracking have reduced the fog of war.
But Do We Really Understand Tanker Activity?
It depends on how accurately we can track vessels.
The familiar model of maritime monitoring, the Automatic Identification System (AIS) signal, breaks down when geopolitics enter the picture. In places such as the Strait of Hormuz and the Red Sea, vessel movements help us assess crude flows and potential market disruptions. But that evidence can be incomplete, delayed, spoofed, or deliberately obscured.
The stakes are especially high in the Strait of Hormuz, one of the world’s most important oil chokepoints. A tanker track through the strait may appear to be a simple line on a map, but in a crisis it becomes a market-sensitive claim about whether oil is moving, whether a cargo is stalled, whether a sanctioned ship transited, or whether traders should price in disruption.
Several categories of maritime risk now shape the operating environment. “Dark vessels” could disappear from normal visibility to conceal port calls, route changes, or ship-to-ship transfers. “Spoofing” involves false position signals that can make a vessel appear somewhere it is not. “Shadow fleets” describe opaque networks of vessels that move sanctioned commodities.
In contested waters, the vessel track is only valuable if it is to be trusted. For energy markets, false signals can quickly become false narratives about supply, disruption, or sanctions risk.
Concluding Thoughts
Ultimately, whether oil prices return to pre-war levels depends on both the formal resolution of the Middle East crisis and the durability of China’s demand slowdown. China’s unusually steep reduction in crude imports, as shown in the “China Imported Surprisingly Less Oil Last Month” chart, has absorbed a large share of the supply shock, but that cushion may prove temporary if economic activity reaccelerates, inventories are rebuilt, or Beijing resumes normal buying patterns. At the same time, today’s oil market is pricing not only barrels, but also information quality. Tanker flows, shadow-fleet activity, spoofed signals, and dark vessels can all distort the narrative around supply risk. For now, surplus inventories, strategic reserve releases, flexible refineries, hopeful political deals, and weaker Chinese demand have kept crude prices contained. But if China’s growth strengthens before geopolitical risks fully fade, and if vessel-tracking data becomes harder to trust, the market could quickly shift from complacency back toward scarcity pricing.
1 https://www.vortexa.com/insights/asia-crude-imports-rebound
Important Disclosures
This material is for general information only and is not intended to provide specific advice or recommendations for any individual. There is no assurance that the views or strategies discussed are suitable for all investors. To determine which investment(s) may be appropriate for you, please consult your financial professional prior to investing.
Investing involves risks including possible loss of principal. No investment strategy or risk management technique can guarantee return or eliminate risk.
Indexes are unmanaged and cannot be invested into directly. Index performance is not indicative of the performance of any investment and does not reflect fees, expenses, or sales charges. All performance referenced is historical and is no guarantee of future results.
This material was prepared by LPL Financial, LLC. All information is believed to be from reliable sources; however LPL Financial makes no representation as to its completeness or accuracy.
Unless otherwise stated LPL Financial and the third party persons and firms mentioned are not affiliates of each other and make no representation with respect to each other. Any company names noted herein are for educational purposes only and not an indication of trading intent or a solicitation of their products or services.
Asset Class Disclosures –
International investing involves special risks such as currency fluctuation and political instability and may not be suitable for all investors. These risks are often heightened for investments in emerging markets.
Bonds are subject to market and interest rate risk if sold prior to maturity.
Municipal bonds are subject and market and interest rate risk and potentially capital gains tax if sold prior to maturity. Interest income may be subject to the alternative minimum tax. Municipal bonds are federally tax-free but other state and local taxes may apply.
Preferred stock dividends are paid at the discretion of the issuing company. Preferred stocks are subject to interest rate and credit risk. They may be subject to a call features.
Alternative investments may not be suitable for all investors and involve special risks such as leveraging the investment, potential adverse market forces, regulatory changes and potentially illiquidity. The strategies employed in the management of alternative investments may accelerate the velocity of potential losses.
Mortgage backed securities are subject to credit, default, prepayment, extension, market and interest rate risk.
High yield/junk bonds (grade BB or below) are below investment grade securities, and are subject to higher interest rate, credit, and liquidity risks than those graded BBB and above. They generally should be part of a diversified portfolio for sophisticated investors.
Precious metal investing involves greater fluctuation and potential for losses.
The fast price swings of commodities will result in significant volatility in an investor’s holdings.
This research material has been prepared by LPL Financial LLC.
Not Insured by FDIC/NCUA or Any Other Government Agency | Not Bank/Credit Union Deposits or Obligations | Not Bank/Credit Union Guaranteed | May Lose Value
For Public Use – Tracking: #1126431